The following is transcript of the Presentation of the Temasek Review 2024. The text should be read in conjunction with the slides shown in this transcript. It has been edited from delivery only for readability.
To refer to a selected transcript of the Question & Answer session which followed, click here.
To see all of the key financial metrics and diagrams in the 2024 Temasek Review, please click here.
Lena Goh:
Good morning, everyone.
Welcome to Temasek Review 2024.
I am Lena Goh from Temasek and I will be your host for this morning.
Our theme this year is "With Tomorrow in Mind",
and our panellists for this year will include our Deputy CEO, Mr Chia Song Hwee; our CFO, Ms Png Chin Yee; our Head of Real Estate, Alpin Mehta; as well as our Head of Financial Services, Ms Connie Chan.
Before I start, we would like to share three key points with you.
- All data that will be presented today is for financial year ended 31 March 2024.
- All currencies quoted in today's materials will be in Singapore dollars, unless otherwise stated.
- Also, all information is embargoed till 3pm Singapore time today.
For those online, if you experience any technical issues, please reach out to us via the WhatsApp hotline that has been shared with you.
A recording of this media briefing will also be made available online after the session.
We will have Connie share with us our performance results and global outlook, followed by Alpin, who will share on our sustainability and community updates. We will then move on to the Q&A session.
Before we start, let us kick off with a short video recapping our year in review.
Connie Chan:
Hi, good morning, everyone.
My name is Connie.
The theme for this year's Temasek Review is,
"With Tomorrow in Mind".
To adapt to a changing world,
we have been actively reshaping our portfolio.
Now, let me take you through our performance review.
Our mandate is to deliver sustainable returns
over the long term.
We have two key performance metrics:
Net portfolio value, or NPV;
and Total Shareholder Return, or TSR.
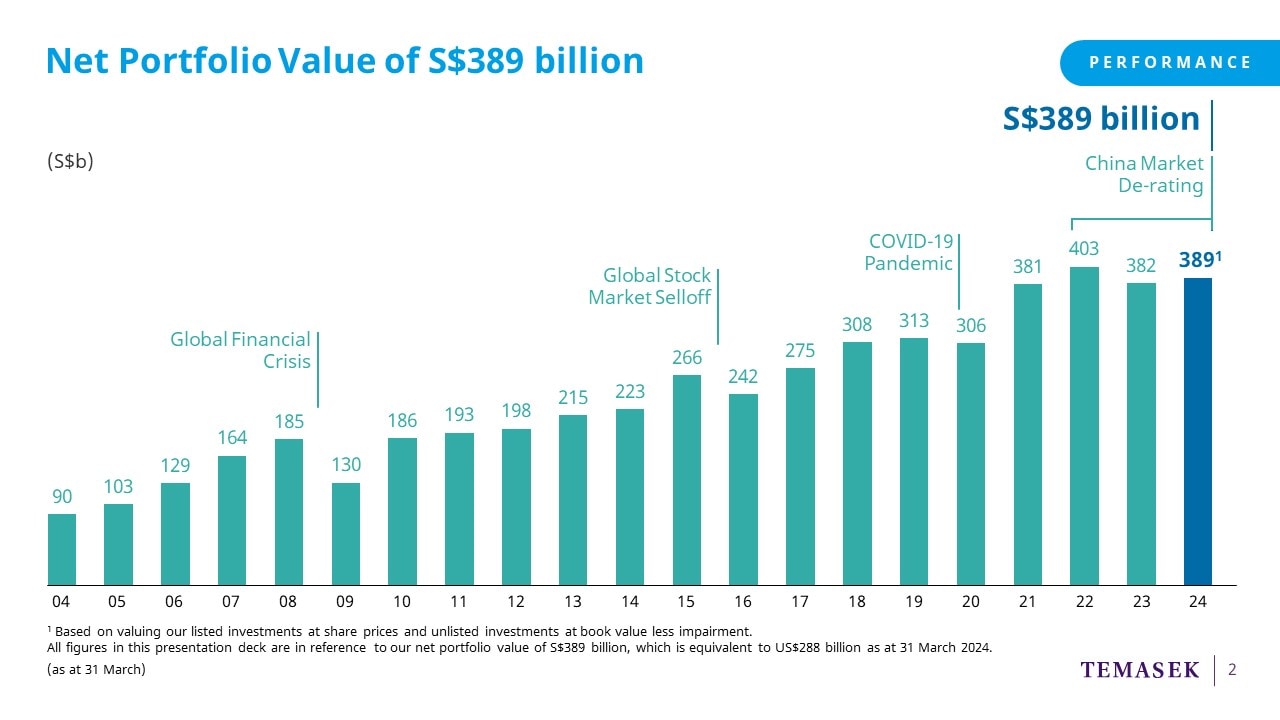
We ended the financial year
with an NPV of $389 billion,
up $7 billion from the previous year.
This was largely due to our returns in the US and India,
offset by the underperformance of China's capital markets.
We continue to grow our NPV through market cycles.
As you can see from the chart,
our portfolio has remained resilient
throughout several market dislocations.
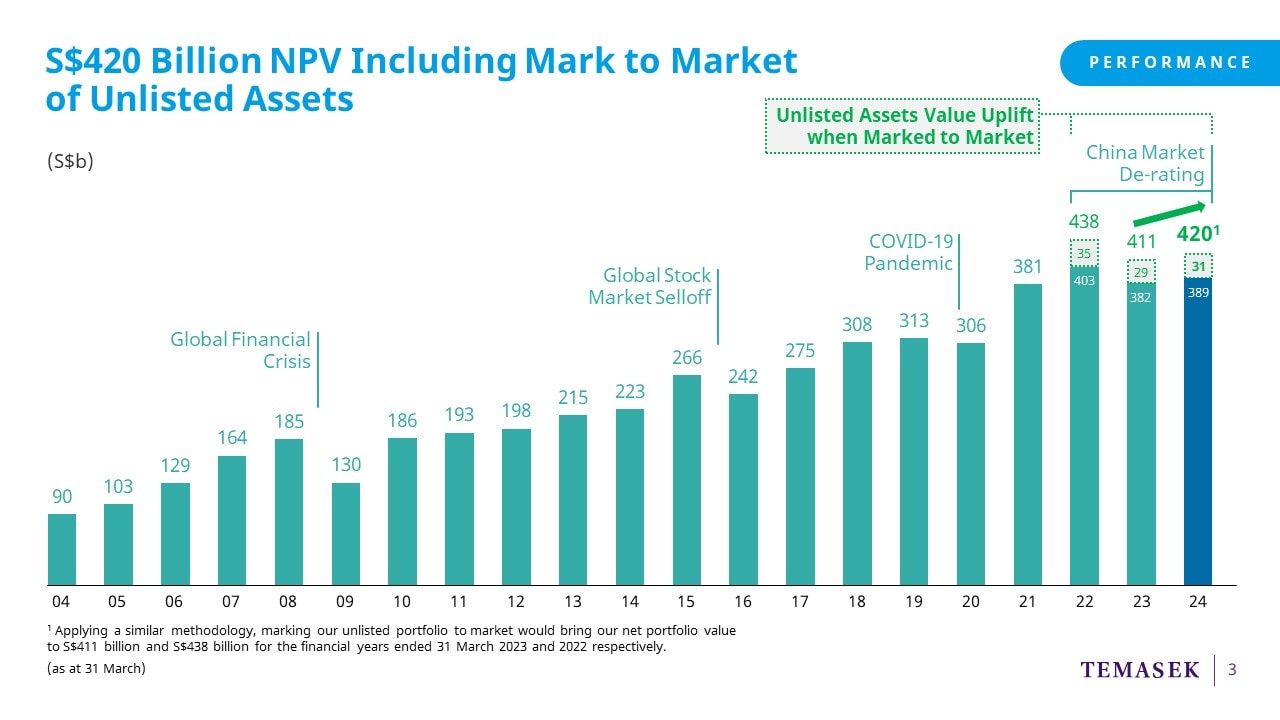
On a mark to market basis,
our NPV is $420 billion,
an uplift of $31 billion.
We have been disclosing
our NPV on a mark to market basis since 2022.
Compared to the Mark to Market NPV
of $411 billion last year, we are up $9 billion this year.
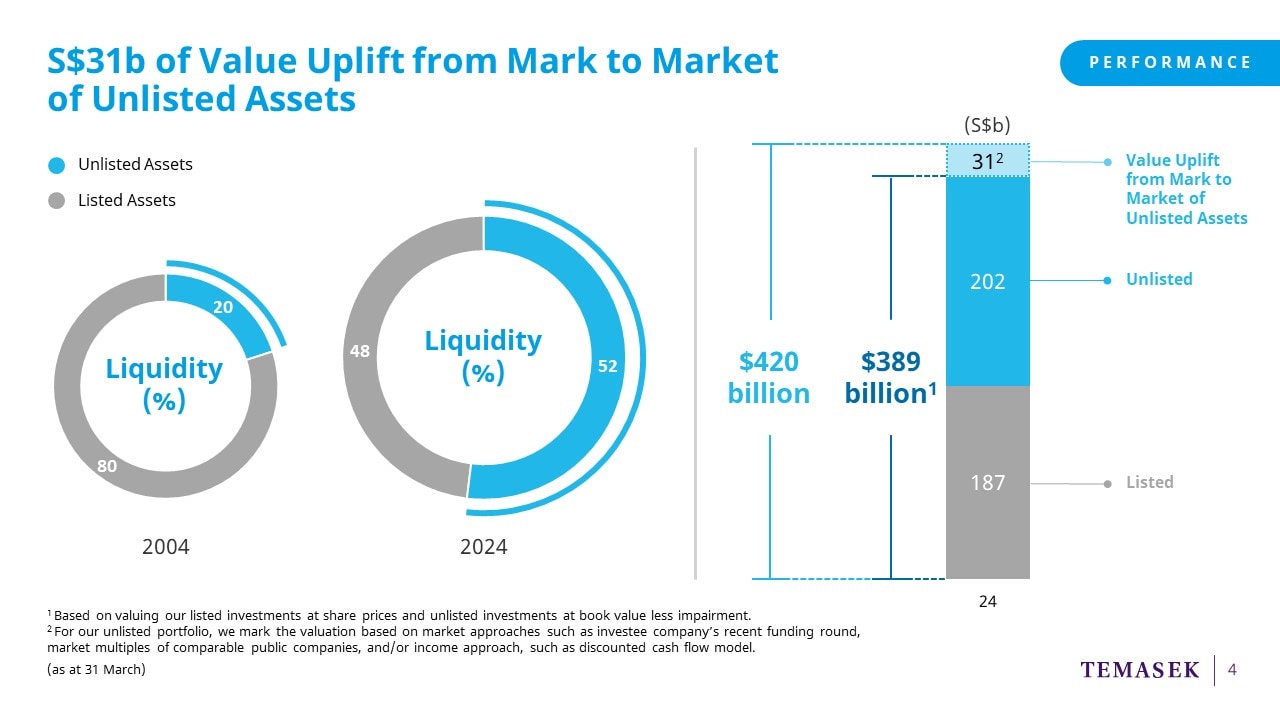
On this next page,
you can see that
our share of unlisted assets has grown from
20% in 2004 to 52% today.
Given that unlisted assets
now make up a majority of our portfolio,
we are often asked about the mark to market value
of our unlisted assets.
This would also facilitate comparisons with peers
who mostly report on a mark to market basis.
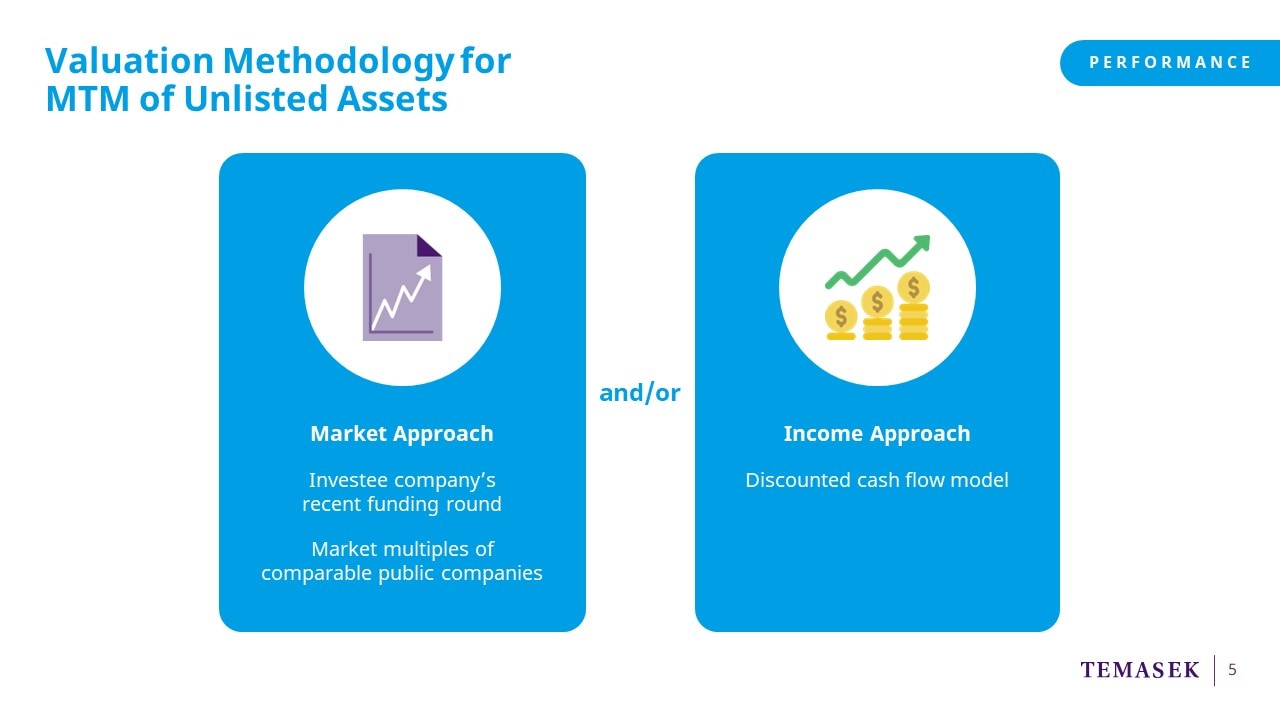
So, what is the difference between
our current approach and mark to market?
Currently, we take the book value
of our unlisted portfolio in our NPV.
Marking to market
would require a market approach.
We would reference an investee company's recent funding rounds
or market multiples of comparable public companies.
In some instances,
such as infrastructure or segments of real estate,
we use an income approach, such as a discounted cash flow model.
As I mentioned previously,
we have been sharing our mark to market valuation
over the last two years, and this year,
we have further refined our methodology
to be consistent with market practice.
You will see that we have presented the mark to market value
for the prior two years on a similar basis for consistency.
Just to be clear, for the purposes of this presentation,
all the figures in the deck will reference our reported NPV of $389 billion.
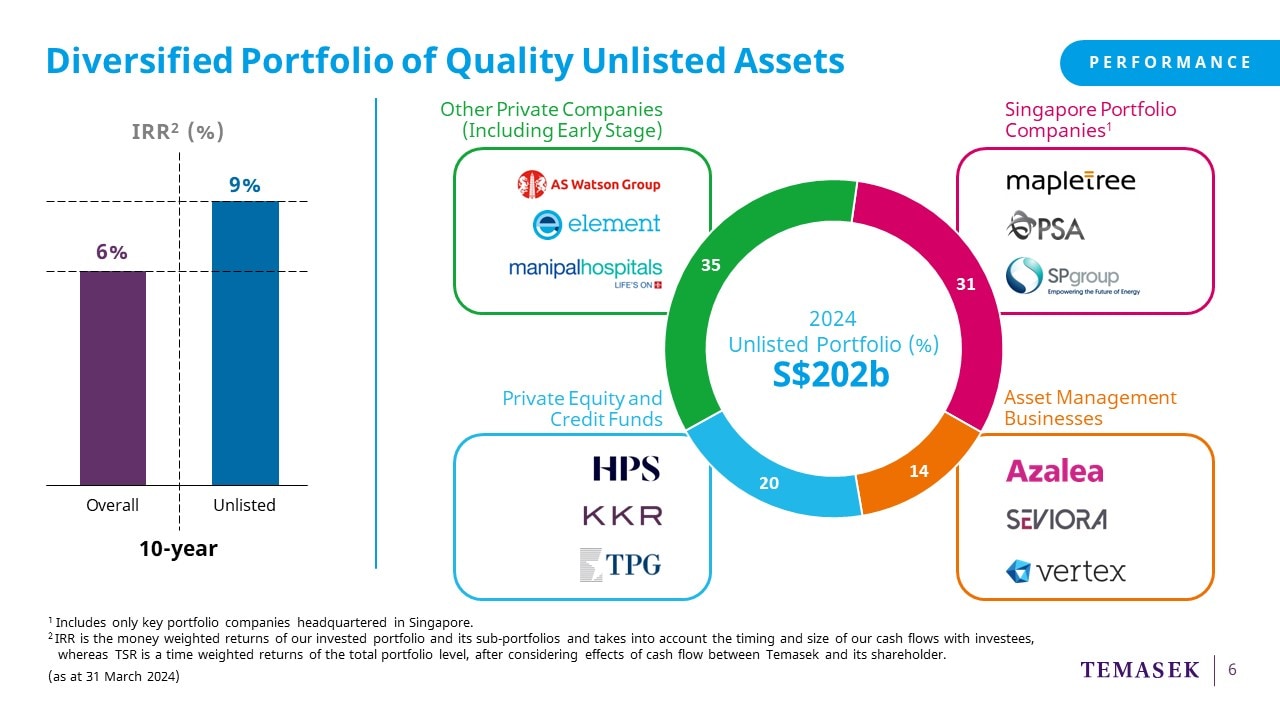
On this next slide,
you can see the breakdown of our unlisted portfolio.
In pink, we have our Singapore Portfolio Companies,
which make up about a third of our unlisted portfolio.
In orange, we have our Asset Management Businesses
and other partnerships.
In blue, you will see our investments
into private equity funds and credit funds.
Investing in funds has enabled us
to gain deeper insights into new markets and sub-sectors,
while providing co-investment opportunities.
Lastly, in green, we have our direct investments
into other private companies, including those in the early stage.
Over the last decade,
our unlisted portfolio has generated returns of 9% per annum,
delivering higher returns than our overall portfolio.
Our unlisted assets have also contributed over $100 billion
of fund distributions and dividends over the same period.
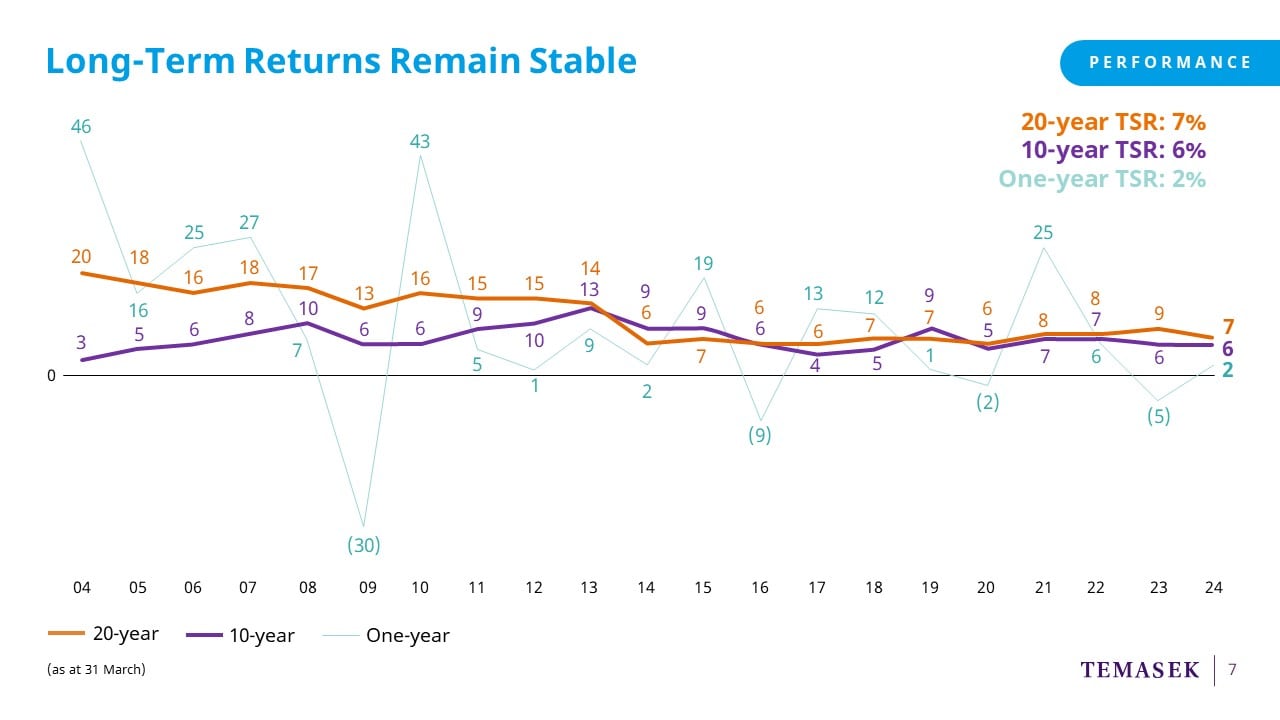
I will now take you through our Total Shareholder Return.
Longer-term TSRs are dependent on the starting and ending year.
This year, our 20-year TSR excludes 2004, which was the post-SARS recovery year.
This explains the drop in our 20-year TSR from 9% to 7%.
Our 10 and 20-year TSRs remain stable.
As you can see from the orange line,
our 20-year TSR was 7%
and our 10-year TSR, as shown in the purple, stood at 6%.
As our investments are primarily in equities,
we are not immune to year-to-year market volatility.
The blue line reflects our one-year TSR,
which was 1.6%, or rounded to 2% in the chart.
As you can see, our longer-term TSRs tend to be resilient
and more representative of our performance.
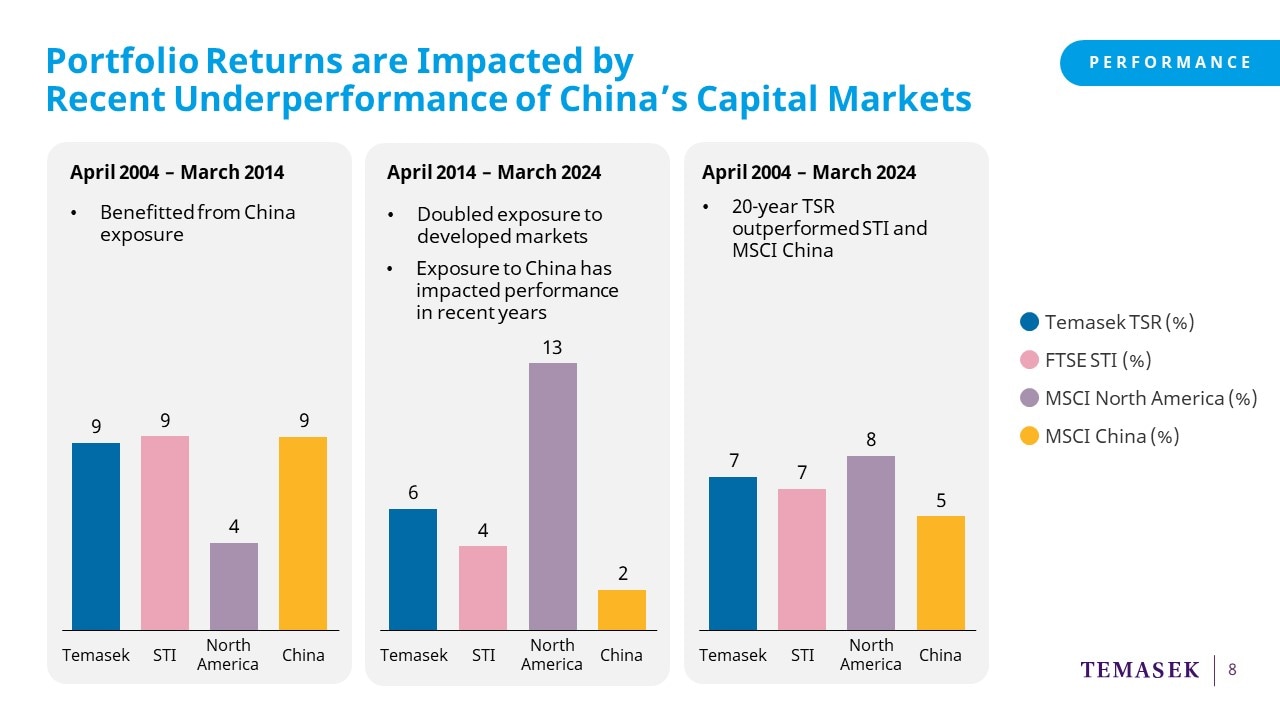
Now, we do not benchmark ourselves against market indices,
as more than half of our portfolio is unlisted.
However, it is useful, as a reference,
to see how public markets have performed in our key geographies.
Now breaking down the returns over the last 20 years.
In the first decade, we benefitted from our exposure in China,
as you can see from the yellow bar.
In the following decade, we doubled our exposure to the US and Europe,
but in recent years, returns were impacted by China's market performance.
As a reference, in the last three years, MSCI China declined by 46%.
Overall, our 20-year returns have outperformed STI and MSCI China.
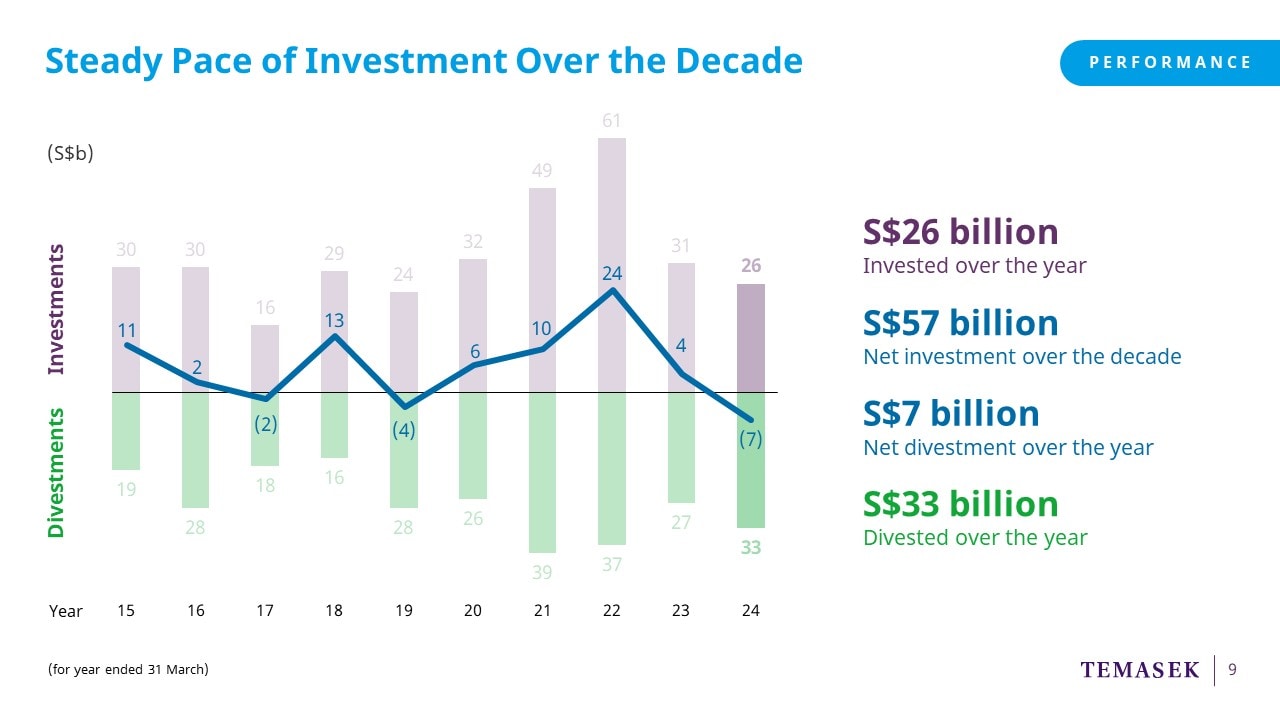
Over the past decade,
we had a net investment of $57 billion.
During this financial year,
we invested $26 billion and divested $33 billion.
This resulted in a net divestment of $7 billion.
Our investment stance was driven by expectations
of a US recession until the Fed pivoted its tight monetary policy
in the last quarter of 2023.
We also saw a slower-than-expected pace of post-COVID recovery in China.
Overall, it was an active investment year for us.
Our key investments included Manipal Health Enterprises,
Element Materials and Authentic Brands Group.
On the divestment side, about $10 billion out of the $33 billion
was actually due to repayment of bonds by Singapore Airlines,
as well as the redemption of preference shares by Pavilion Energy.
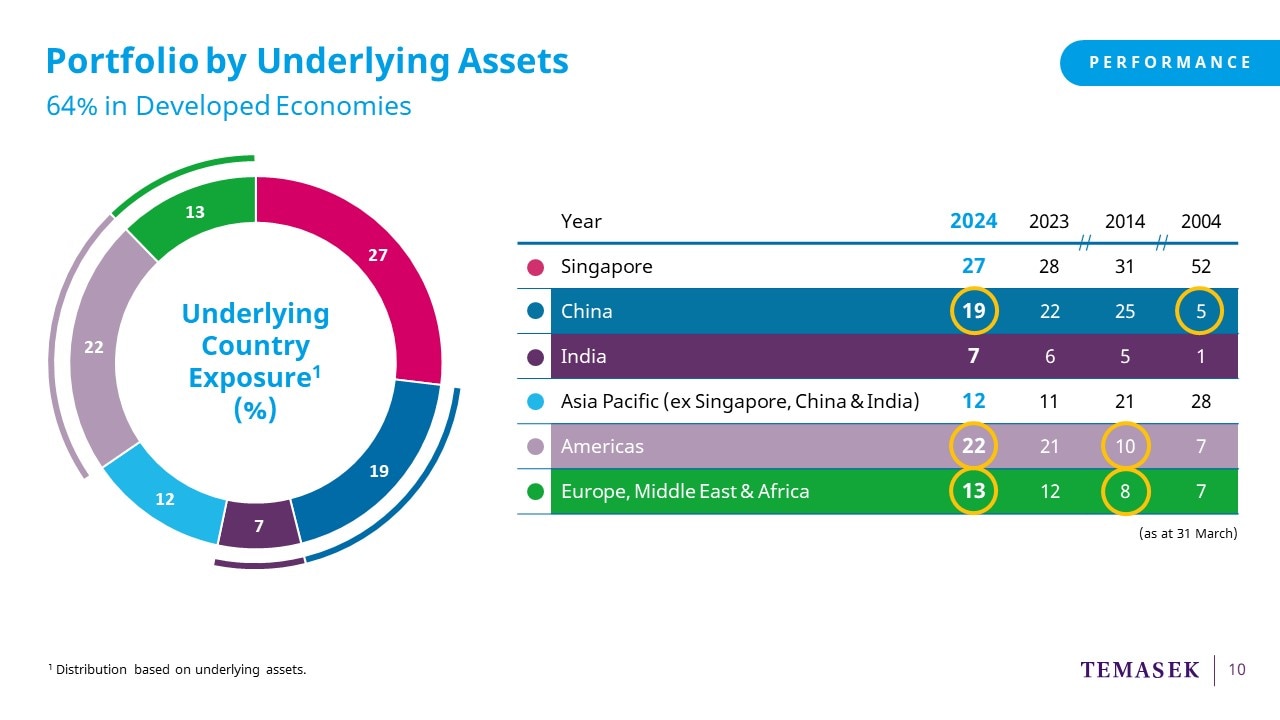
On this page, we show our portfolio
based on underlying exposure.
We have been actively reshaping our portfolio
as we seek to deliver long-term sustainable returns.
Two decades ago,
we started growing our exposure in Asia, mainly in China.
Over the past decade,
we doubled our exposure to developed economies
such as the US and Europe.
We have also been stepping up our investments in India
as we see more opportunities
in consumer, healthcare and financial services sectors.
This has contributed to the resilience of our longer-term returns.
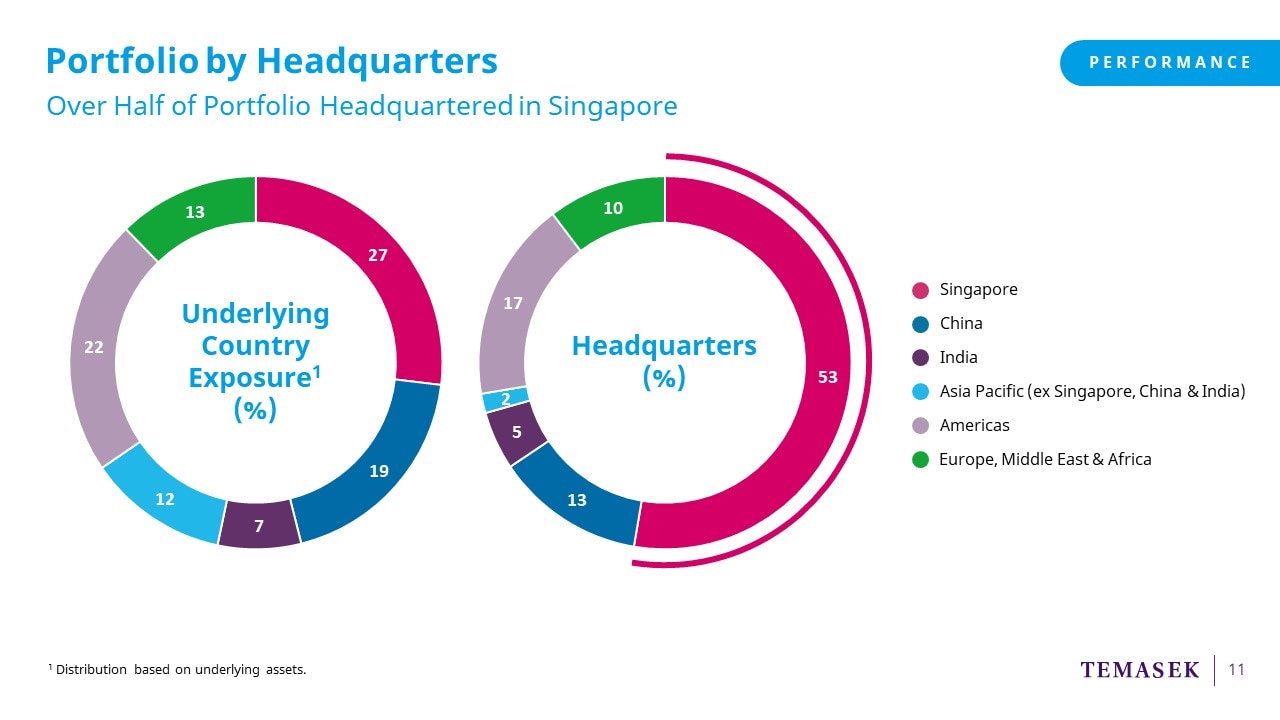
While our portfolio diversified based on underlying exposure,
it is useful to note that over half of our portfolio companies
are headquartered in Singapore,
as you can see in the chart on the right.
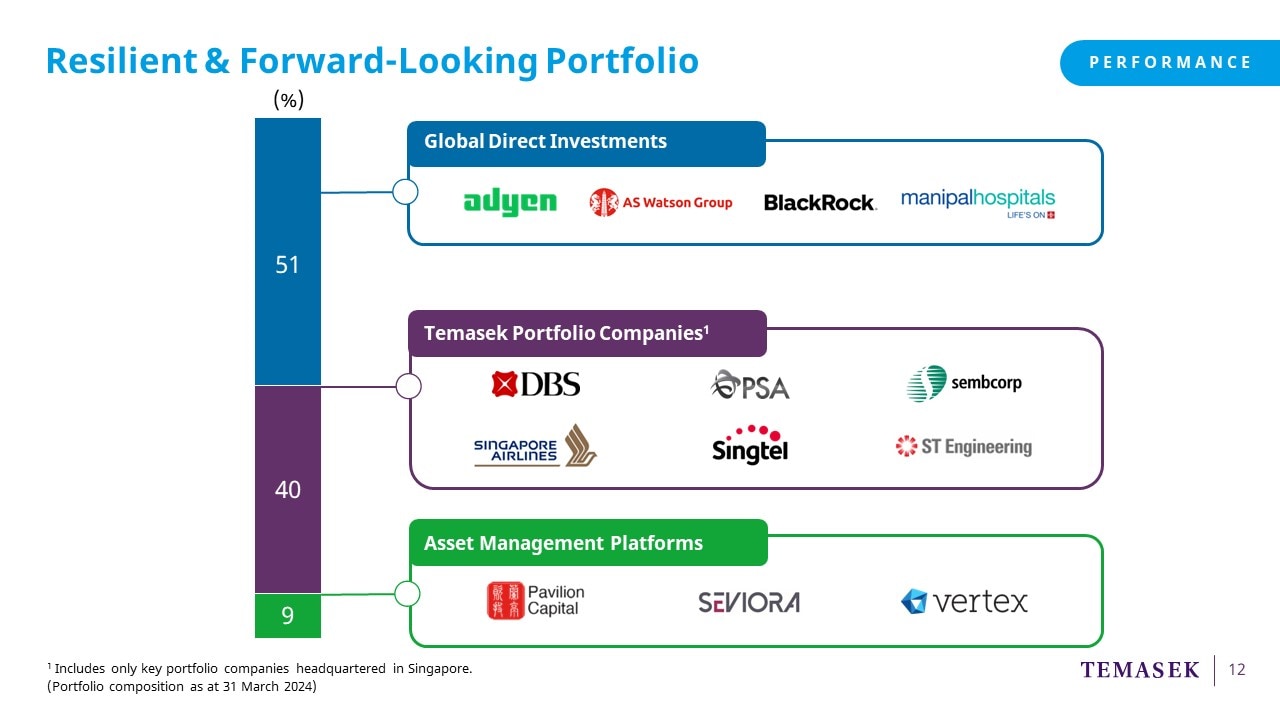
Now, there are three components
in the resilient and forward-looking portfolio
which we are building over the long term.
First, we have our Global Direct Investments,
which comprise 51% of our portfolio.
Here, we focus on both public and private investments,
aligned to our four structural trends.
Second, we have our Singapore-based
Temasek Portfolio Companies, or TPCs,
which make up 40%.
Our TPCs are stalwarts of our portfolio
and have historically provided stable returns across market cycles.
Lastly, we have our Asset Management companies,
which make up the rest of the portfolio at 9%.
Here, we partner with third parties
to scale capital across different investment strategies.
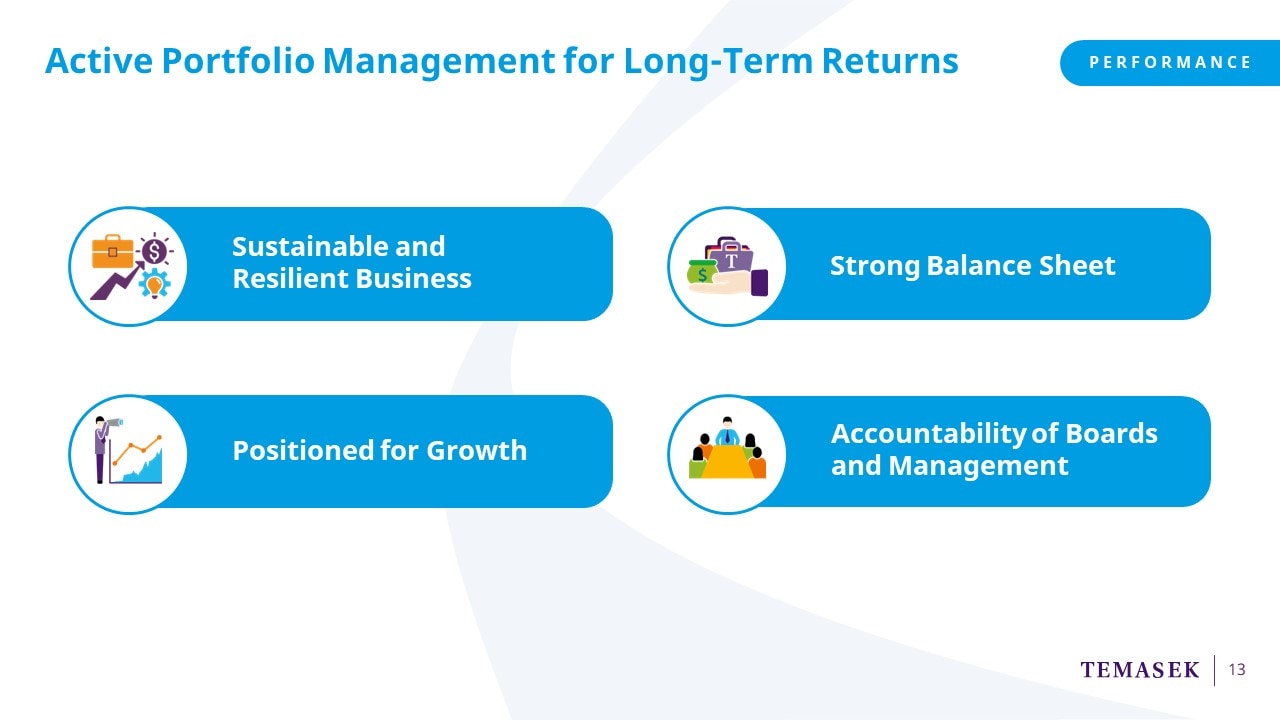
As an active shareholder,
we engage with our portfolio companies
on their growth strategies and plans to create shareholder value.
In our engagement,
we are focused on key areas, including:
One, are there ways to increase
sustainability and resilience of the business?
Two, do they have the balance sheet strength
to withstand shocks and also
execute on their longer-term plans?
And, three, are they positioned for growth
and performance over the long term?
Now, this applies to both our Direct Investment companies
as well as our TPCs.
But what to do, and how to do it,
that is really up to the companies themselves.
We do not direct our portfolio companies
on their strategies or day-to-day operations.
We hold the Boards and the Management teams
accountable for their operating performance.
As a shareholder,
we may support our portfolio companies
through our shareholder vote,
to help them pivot or advance their strategic plans.
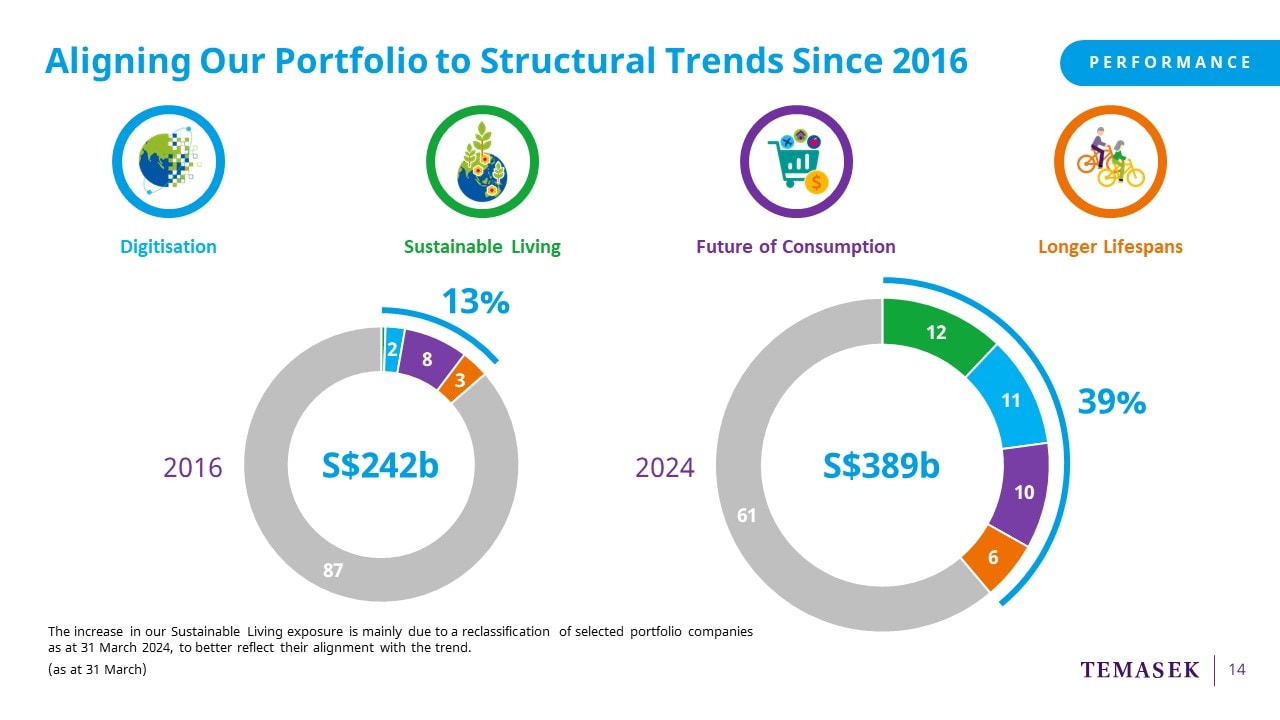
Now let me share with you
how we have been investing into our four structural trends.
This helps us construct
a more resilient and forward-looking portfolio.
Digitisation and Sustainable Living
have pervasive impact across
all sectors and business models.
Future of Consumption and Longer Lifespans
reflect shifts in consumption patterns
and addresses the needs
of a growing and ageing population.
Today, these investments make up 39% of our portfolio,
compared to 13% in 2016.
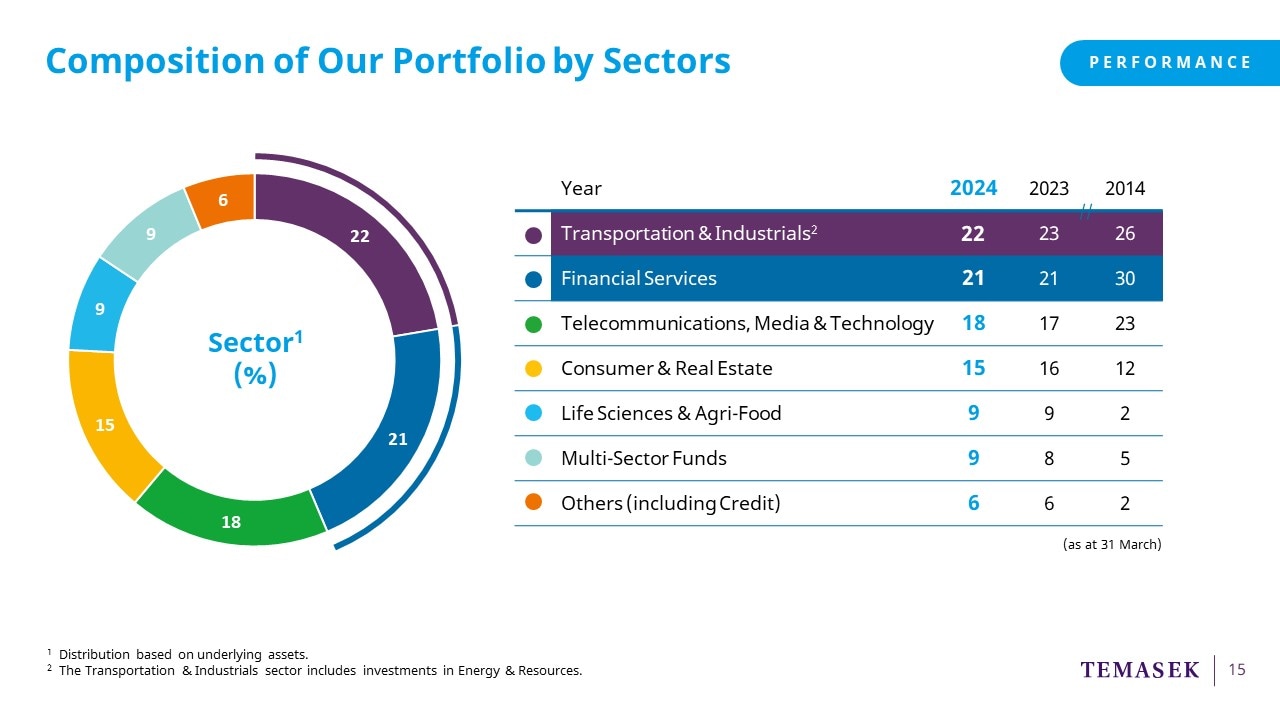
Now moving on to portfolio composition by sectors.
Over the past year,
we made significant investments in
the consumer, financial services, healthcare, and technology sectors.
Transportation & Industrials and Financial Services remain our two largest sectors.
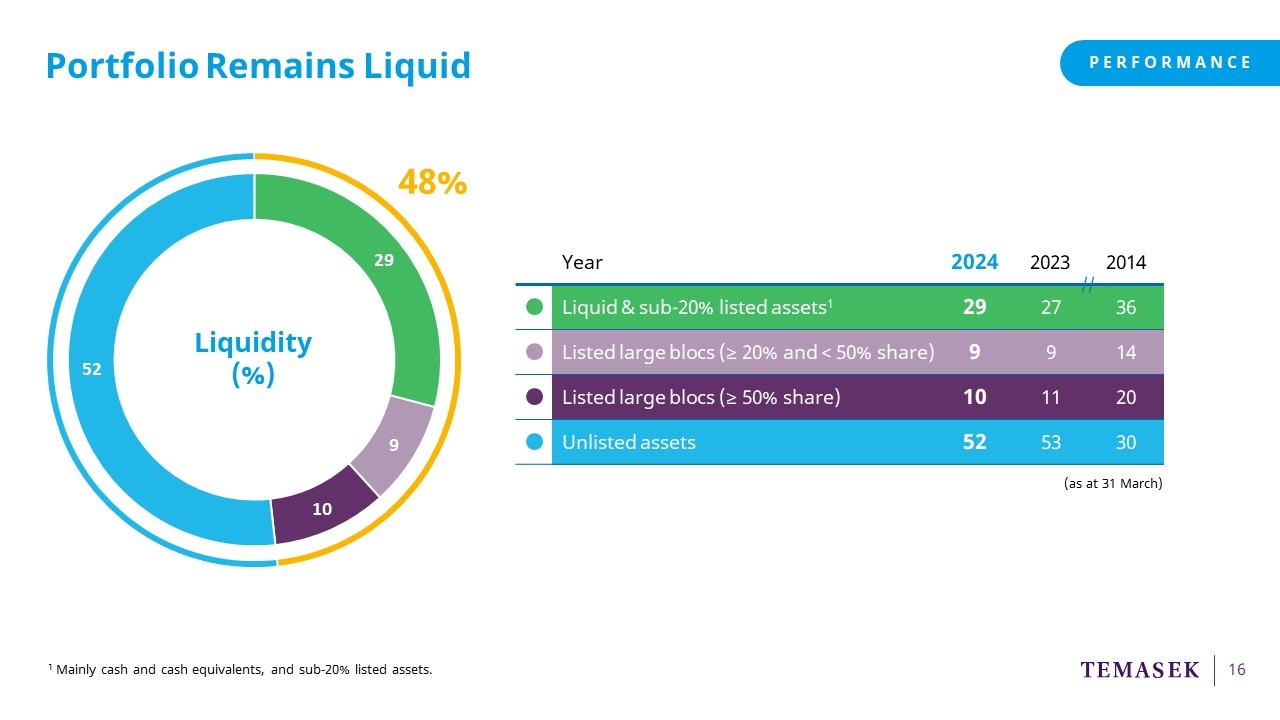
On this page, we show the liquidity profile of our portfolio.
Our portfolio remains liquid.
48% of our portfolio is invested in liquid and/or listed assets,
while 52% is in unlisted assets.
Both our listed and unlisted assets
offer us liquidity through divestments, dividends, and distributions.
We also achieve liquidity
from our unlisted portfolio through public listings.
For example, some of our portfolio companies,
such as DoorDash, Intapp,
Gracell Biotechnologies and Zomato,
have listed over the past five years.
I will next take you through
our outlook for the year ahead,
including sharing more
about our investment stance.
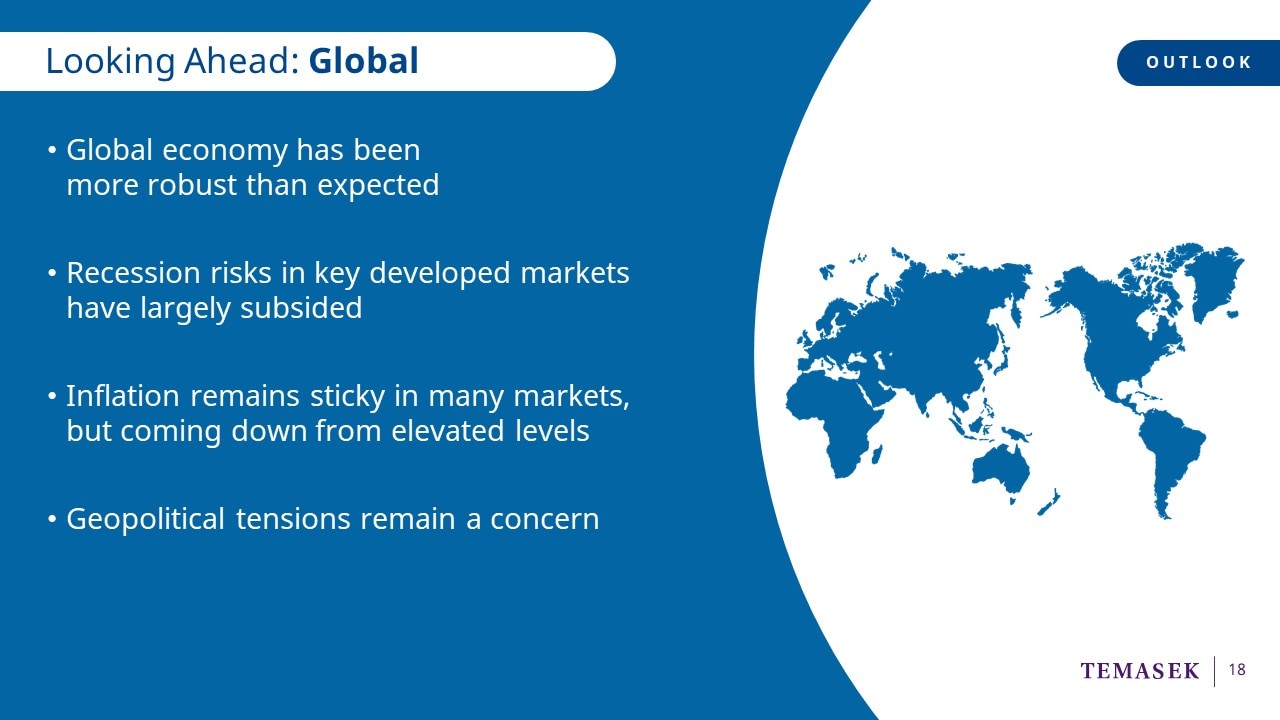
The global economy has been more robust than expected.
Recession risks in key developed markets
have mostly subsided.
While inflation remains sticky in many markets,
we are seeing inflation coming down from elevated levels.
This could give central banks more confidence
to ease monetary policy.
Some are already beginning the process.
Despite the better growth outlook, there are still risks.
Geopolitical tensions remain a key concern,
for example, US-China relations and conflicts in Ukraine and Gaza.
The elections in the US and other countries
could also add more complexity.
Now diving deeper into each market,
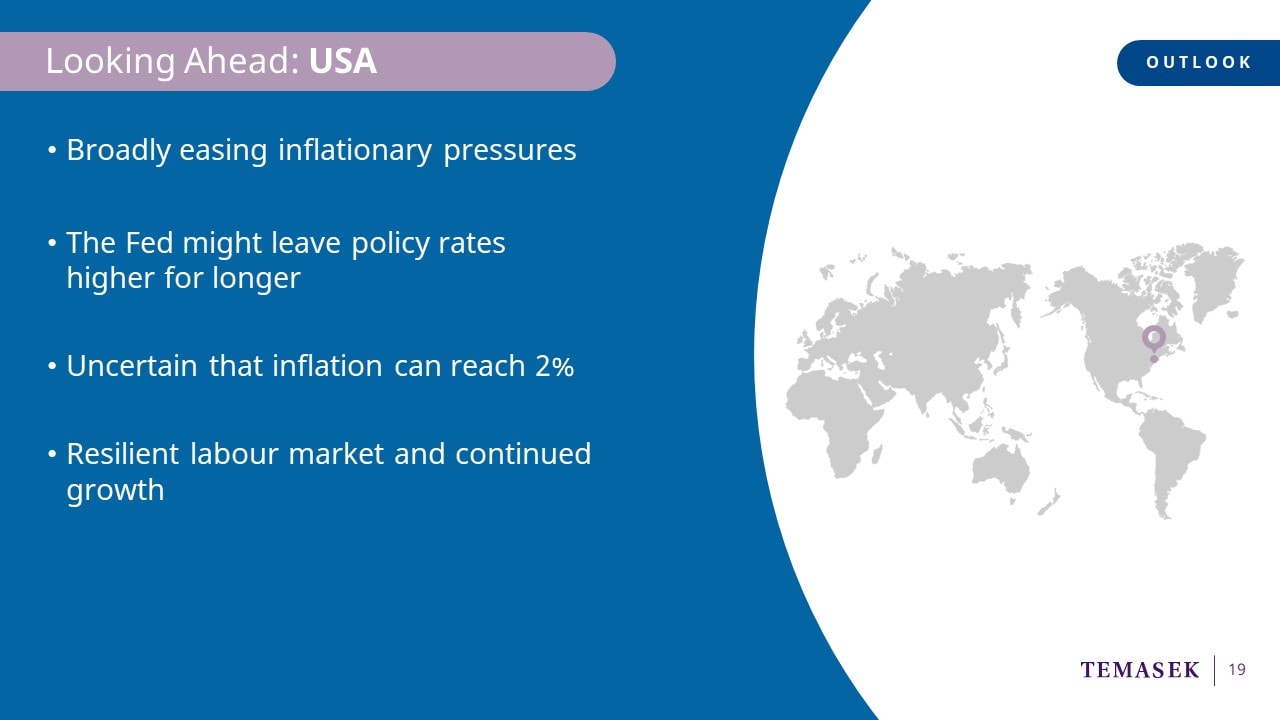
starting with the US.
In the US, inflationary pressures have eased,
due to expansionary supply factors,
especially higher immigration flows.
However, it is possible that the Fed
might leave policy rates higher for longer,
due to an unclear inflation path,
a resilient labour market and continued growth.
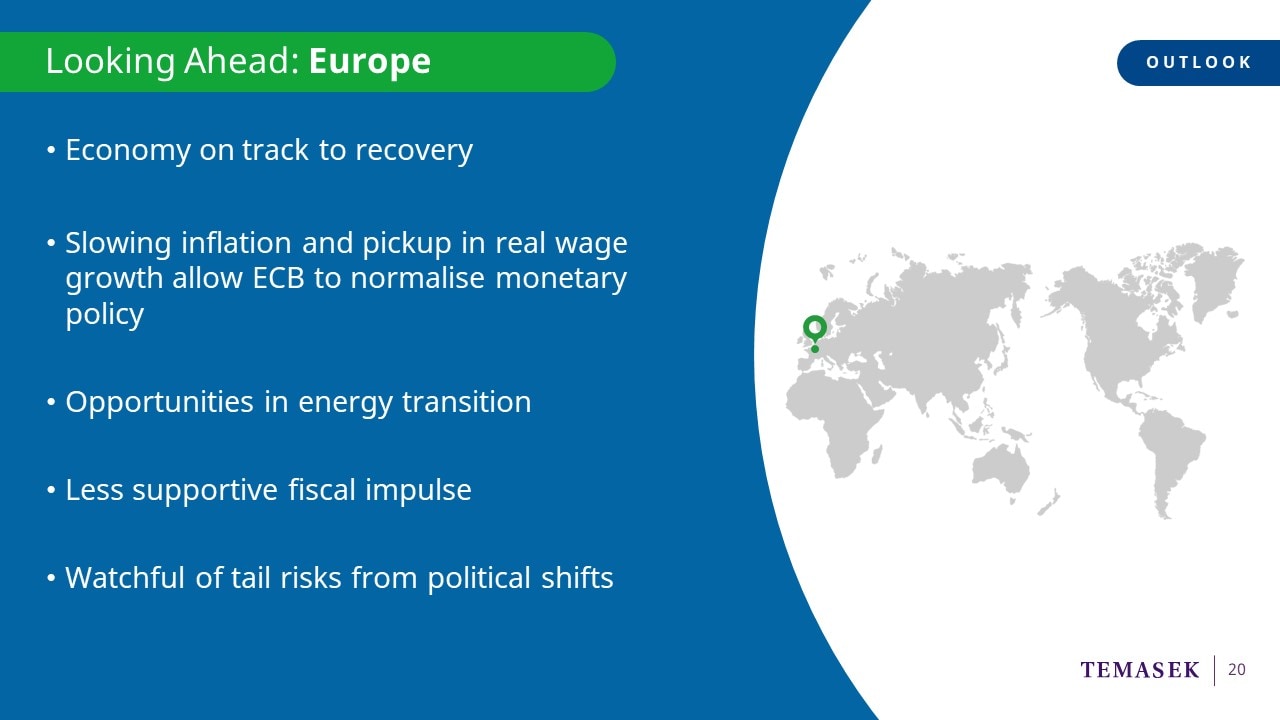
Next, on to Europe.
The Eurozone is recovering.
Slowing inflation, credit growth
and a pickup in real wages
have allowed the European Central Bank to normalise policy.
In the long term, energy transition presents opportunities
for infrastructure development across Europe.
That said, we are watchful of two main risks:
1. Less supportive fiscal impulse, and
2. Tail risks from political shifts in the region.
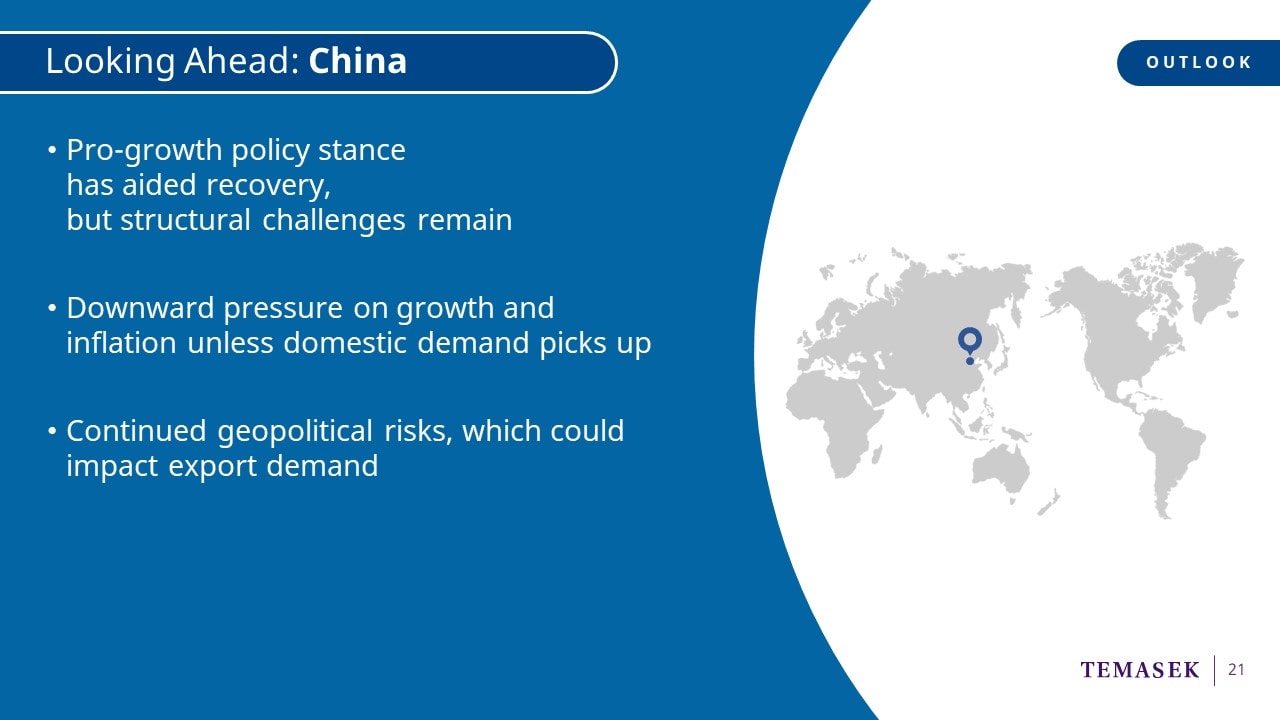
Moving on to China.
China is maintaining a pro‑growth policy stance.
This has aided China in recovering from a cyclical bottom,
but structural challenges remain.
Global MNCs have accelerated diversification of supply chains.
This could lower productivity gains.
Yet, China's supply capacity remains highly efficient and competitive.
However, without a commensurate pickup in domestic demand,
growth and inflation will continue to face downward pressure.
Geopolitical tensions and threats of additional tariffs
could also impact export demand for Chinese goods.
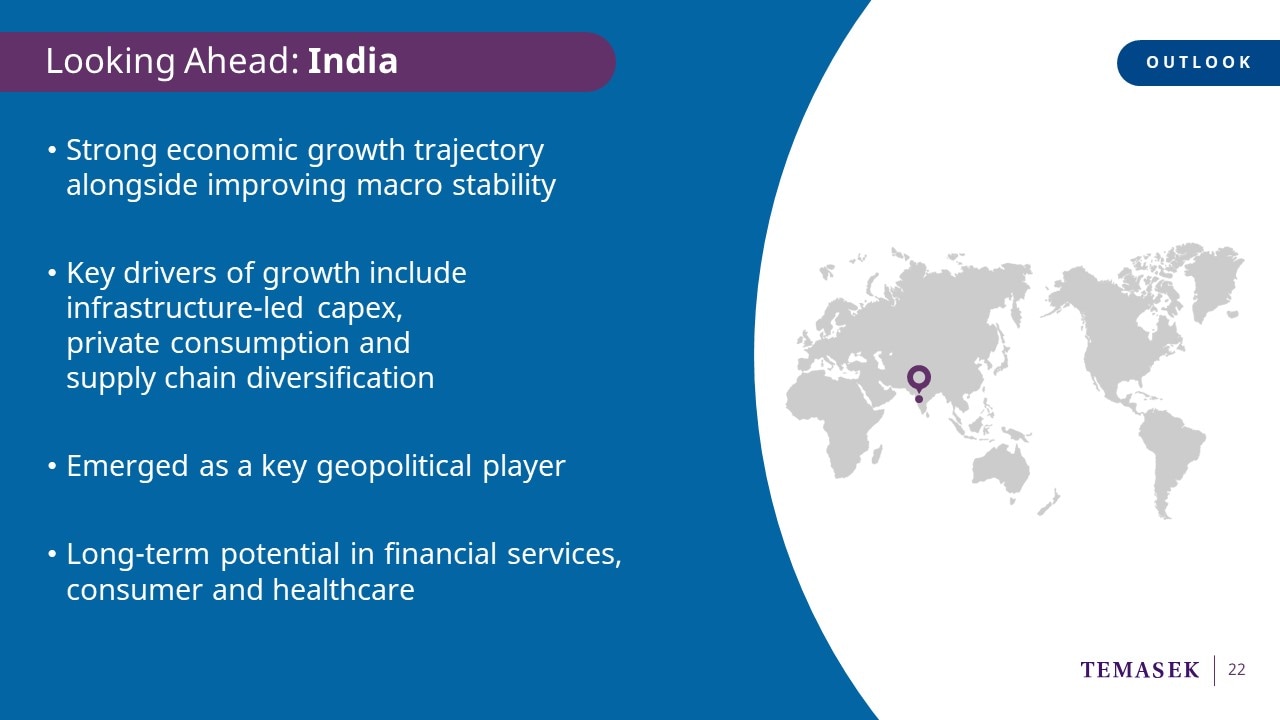
Looking ahead at India.
India has continued to see strong economic momentum
alongside improving macro and political stability.
India's growth will be driven by
infrastructure-led capex and private consumption.
They also benefit from supply chain diversification.
We also see India emerging as a key geopolitical player.
We see long-term potential in financial services,
consumer, as well as healthcare sectors.
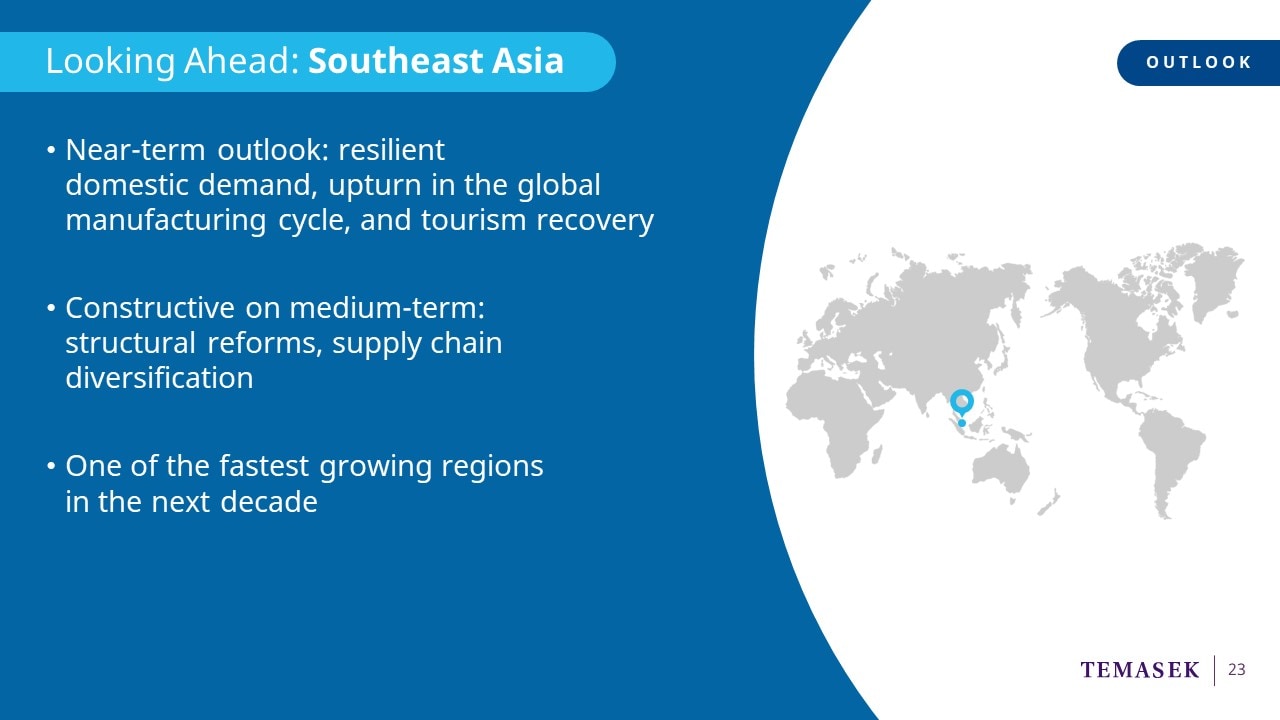
Lastly, on Southeast Asia.
Our near-term outlook for Southeast Asia remains positive.
There is a resilient domestic demand,
an upturn in the global manufacturing cycle and recovery in tourism.
Over the medium-term, we remain constructive on the region.
We see continued structural reforms in a number of markets.
This has helped to reduce supply-side constraints,
create more open and competitive markets,
as well as improve productivity.
The region is well-positioned against a backdrop
of rising US-China tensions and also supply chain diversification.
Over the next decade, we expect Southeast Asia
to be one of the fastest-growing regions globally.
Now, let me share more with you
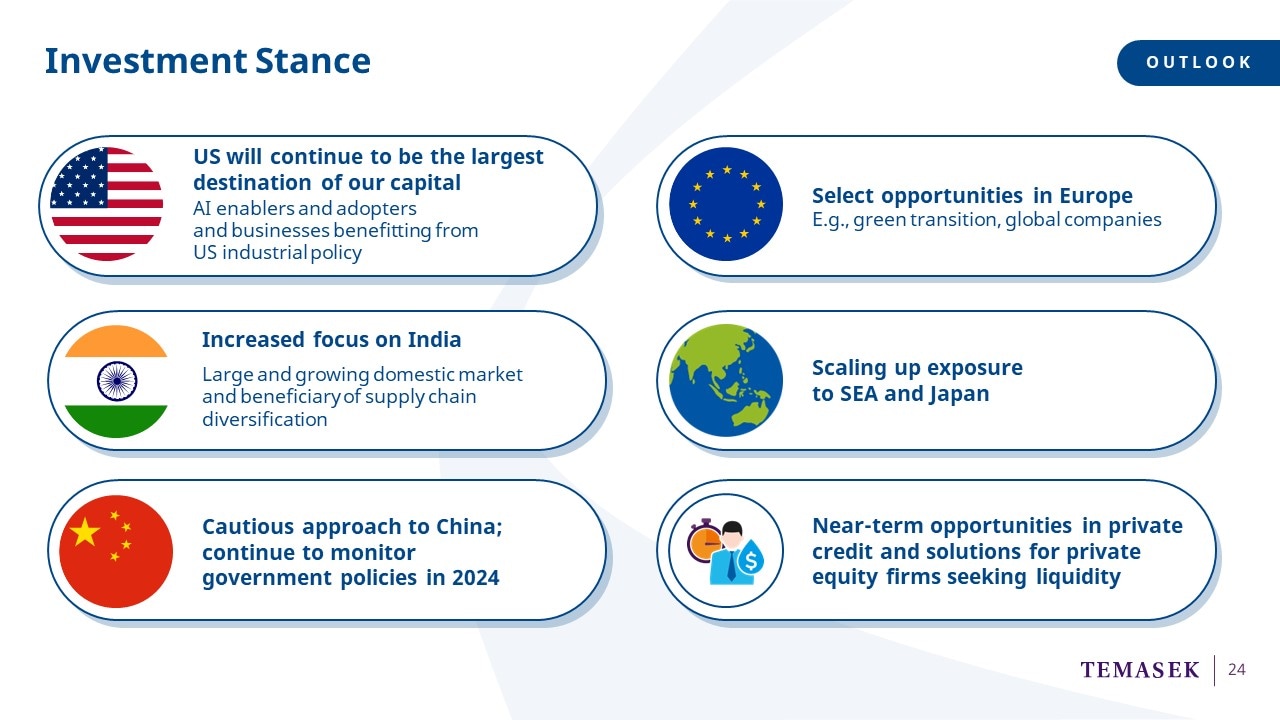
about our investment stance moving forward.
The US continues to be the largest destination of our capital.
We will focus on AI enablers and adopters,
as well as businesses benefitting from US industrial policy.
We also see opportunities in Europe,
especially in green transition and leading global companies.
We will increase our focus on India,
as it has a large and growing domestic market,
in addition to being a beneficiary of supply chain diversification.
India has also seen the growth of innovative domestic businesses.
In the rest of Asia, we are looking to increase our exposure
to Southeast Asia and Japan.
On China, we maintain a cautious approach
and we will continue to monitor government policies this year.
In the near-term, we see opportunities in private credit
and providing solutions in private equity firms seeking liquidity.
With that, I will now pass it to Alpin to go over our next sections.
Thank you.
Alpin Mehta:
Thank you, Connie.
My name is Alpin and I will be taking you through
our sustainability and community segments.
Our focus on sustainability extends
from our portfolio, to planet, to people.
Our commitment to sustainability is key
to building a thriving and a resilient portfolio.
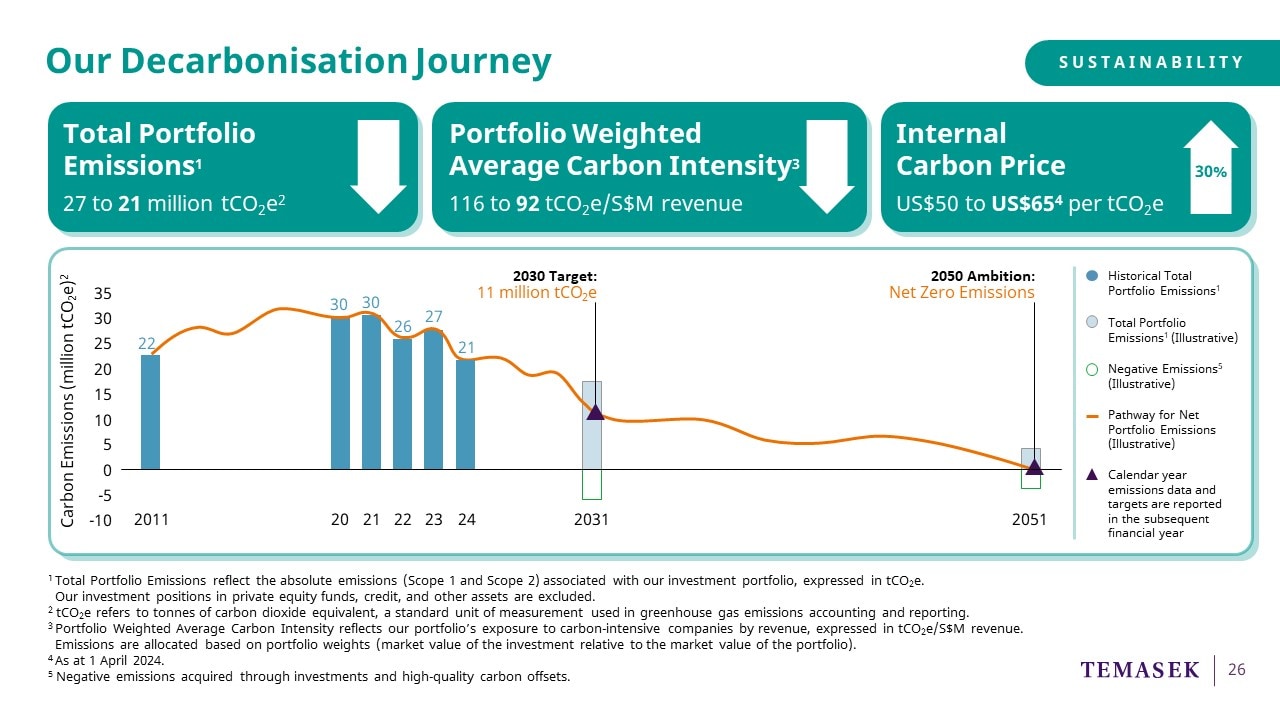
So, what progress have we made over the year?
Firstly, Total Portfolio Emissions have decreased
to 21 million tonnes of carbon dioxide equivalent.
The path towards net zero will not be a linear one,
but we remain committed to reducing half
of our 2010 net emissions by 2030, and eventually,
we aim for net zero emissions by 2050.
Secondly, Portfolio Weighted Average Carbon Intensity
has also decreased to 92 tonnes per million dollars of revenue.
And lastly, we have increased our internal carbon price
to US$65 since 1 April 2024.
We expect to progressively increase this to US$100 by 2030.
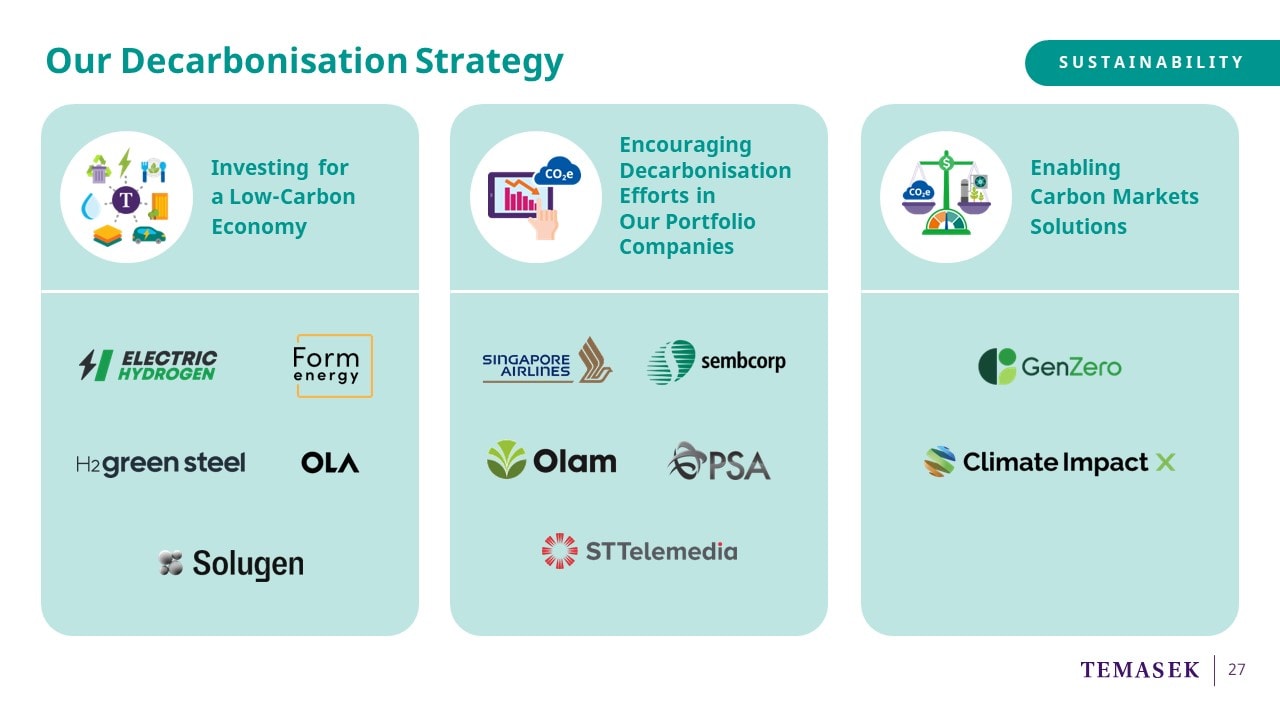
Our efforts are underpinned by our three pathways.
Number one, to invest for a low-carbon economy.
Some examples here include Electric Hydrogen, an electrolyser company,
and Ola Electric, an electric two-wheeler manufacturer.
Number two, we encourage decarbonisation efforts in our portfolio companies.
Singapore Airlines, PSA and SembCorp are such examples.
And number three, we enable carbon markets solutions.
We do this through our platforms GenZero and CIX.
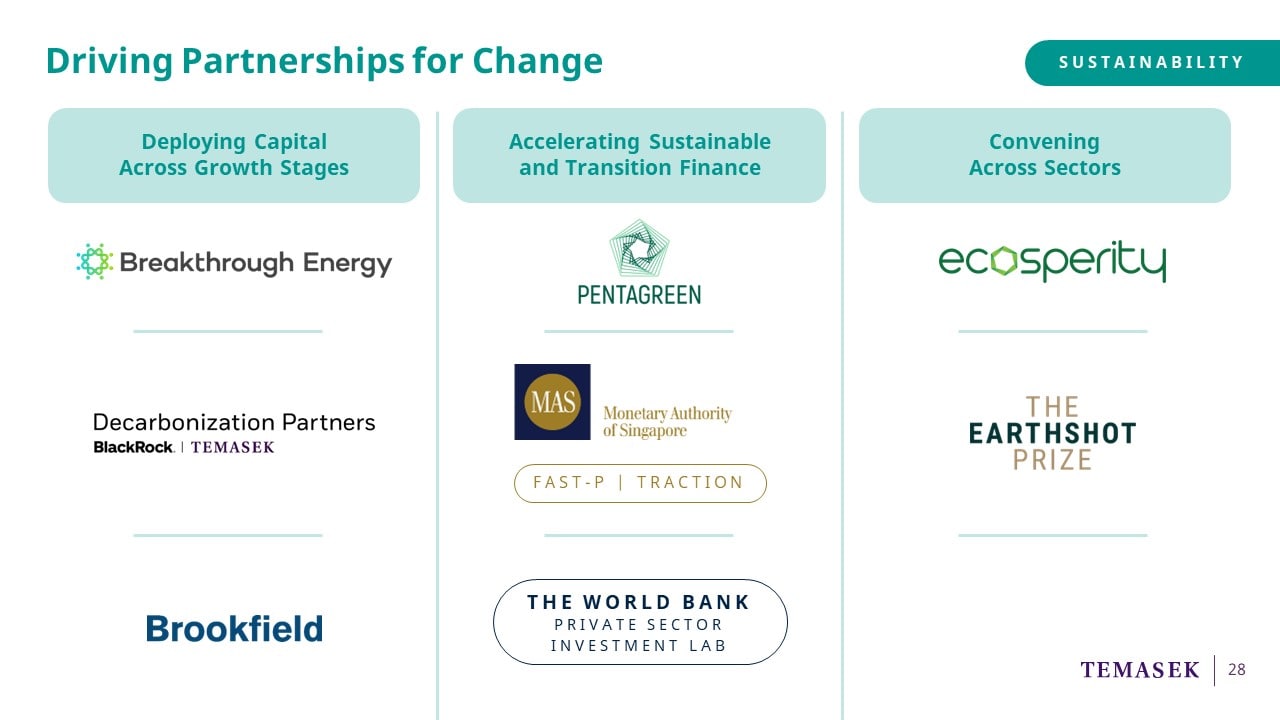
In order to achieve our sustainability goals,
partnerships are essential.
We build strategic partnerships
to build capabilities and deploy capital across growth stages.
We formed a partnership
with Breakthrough Energy and Enterprise Singapore
to set up a fellowship programme
to enhance capabilities and scale climate tech solutions in Southeast Asia.
We partnered BlackRock to form Decarbonization Partners.
In April this year, it announced the close
of its US$1.4 billion funding round.
And more recently,
we partnered Brookfield to invest in Neoen,
a French global renewable energy company.
We also form partnerships to address climate financing gaps.
Pentagreen Capital, our joint venture with HSBC,
provides financing for sustainable infrastructure projects in Asia.
If you are looking for more details,
you may refer to our inaugural Sustainability Report,
which we launched today.
It brings together our sustainability disclosures
and tracks the progress we have made.
Next, I will be presenting our community efforts
and how we contribute to uplifting our communities.
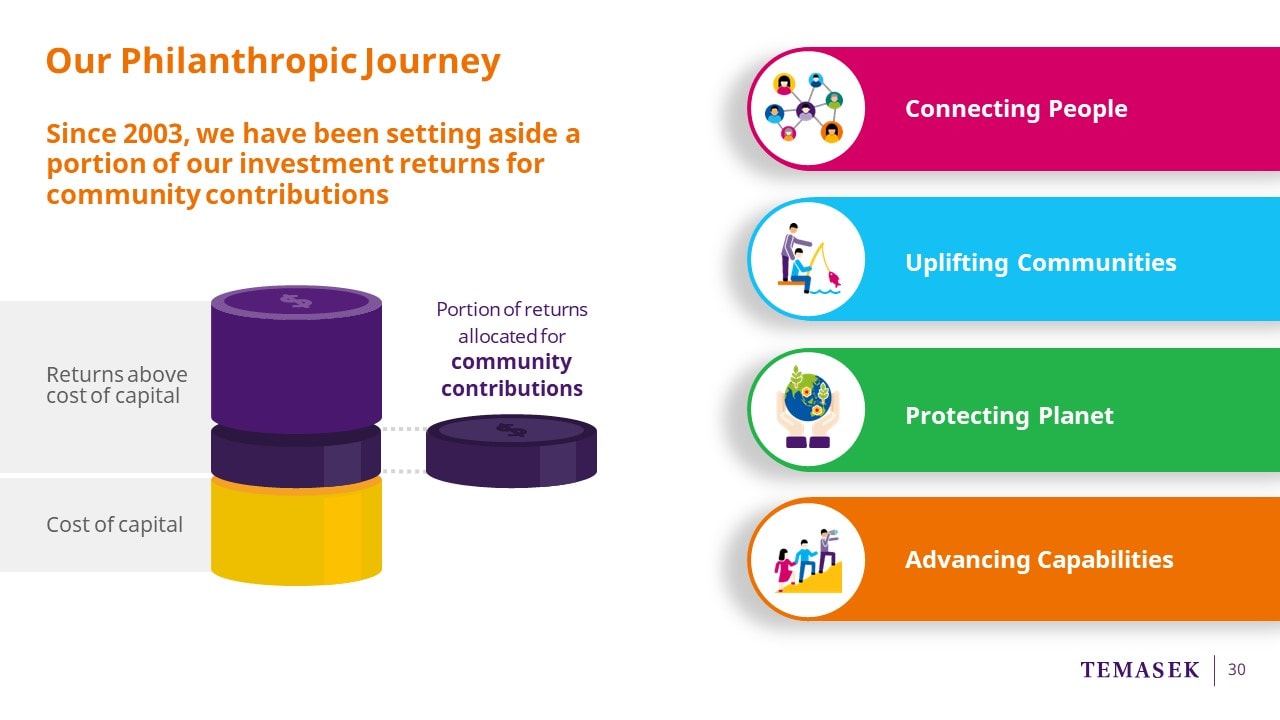
Since 2003, we have been setting aside
a portion of our returns above the cost of capital for community gifts.
Our not-for-profit gifts are approved by the Temasek board
and then donated to partners to achieve our four community objectives.
They are:
Connecting People,
Uplifting Communities,
Protecting Planet
and Advancing Capabilities.
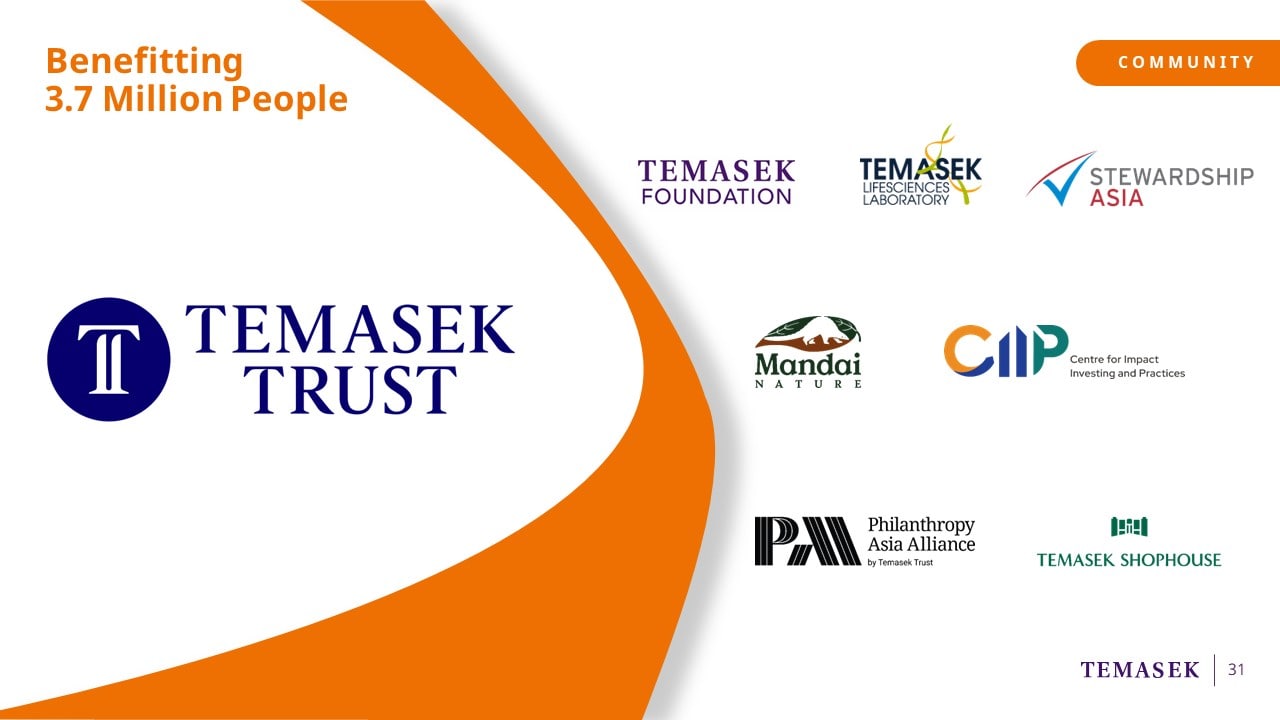
Temasek Trust manages the funds
and disburses the gifts via grants and endowments
to the non-profit ecosystem in Singapore and beyond.
To date, our gifts to Temasek Trust
have benefitted about 3.7 million people.
To mark our 50th anniversary this year,
we announced a $150 million T-Spring gift to the community.
This gift will be used to advance capabilities
and better prepare Singapore's workforce and organisations.
It supports skills development, scholarships, and fellowships.
This is our tribute to Singapore's past, present, and future generations.
This leads us back to our purpose, "So Every Generation Prospers".
Our purpose guides us in everything we do.
Beyond just being an investment firm,
we are aware of how our actions today
will impact future generations to come.
And with this, I conclude my presentation.