This site uses cookies. By continuing to browse the site you are agreeing to our use of cookies. For more details about cookies and how to manage them see our cookie policy.
About Us
An active investor, forward looking institution and trusted steward
The following is a transcript of the Presentation of the 2016 Temasek Review. The text should be read in conjunction with the slides shown in this transcript. It has been edited from delivery only for readability. To refer to a selected transcript of the Question & Answer session which followed, click here.
STEPHEN FORSHAW:
Good afternoon, everyone. Welcome to Temasek's annual Temasek Review for 2016. My name is Stephen Forshaw, and on behalf of all of us at Temasek, welcome to today's presentation. The theme of today's presentation ‑ Generational Investing. We're going to spend a little time with you this afternoon taking you through our year, performance review and outlook. The format for this afternoon is that we will be opening with a video presentation, and then two of my colleagues, Png Chin Yee and Michael Buchanan will give a presentation. Chin Yee is our Head Financial Services and Senior Managing Director, China. Michael is our Head, Strategy and Senior Managing Director, Portfolio Strategy and Risk Group. Chin Yee will speak about the year in review and Mike will speak about our outlook going forward.
After the presentation, Chin Yee and Mike will be joined on the stage for a Q&A session. We'll have Dilhan Pillay our President, Joint Head of the Investment Group, Enterprise Development Group and Singapore, and Head, Americas. Chia Song Hwee, Joint Head of the Investment Group, Portfolio Management Group and Singapore, and Rohit Sipahimalani who is the Joint Head of the Portfolio Strategy and Risk Group and Joint Head of India, will join Chin Yee and Mike for the Q&A session.
Unless stated otherwise, all figures presented today are in Singapore dollars. Singapore dollars is our reporting currency so unless stated otherwise, everything is in Singapore dollars. The report covers our financial year which is 1 April 2015 to 31 March 2016.
So now let me, if I may, start today's proceedings with the video presentation which is the high‑level overview of our year 2015‑2016 and then Chin Yee will come up and take over the presentation.
PNG CHIN YEE:
Good afternoon, my name is Chin Yee. I trust you've enjoyed the video. We thought it would be interesting for you to see in a new format how we're shaping our institution for the future. Mike and I will be taking you through our year in review and our outlook today and I will kick off with the review of our performance.
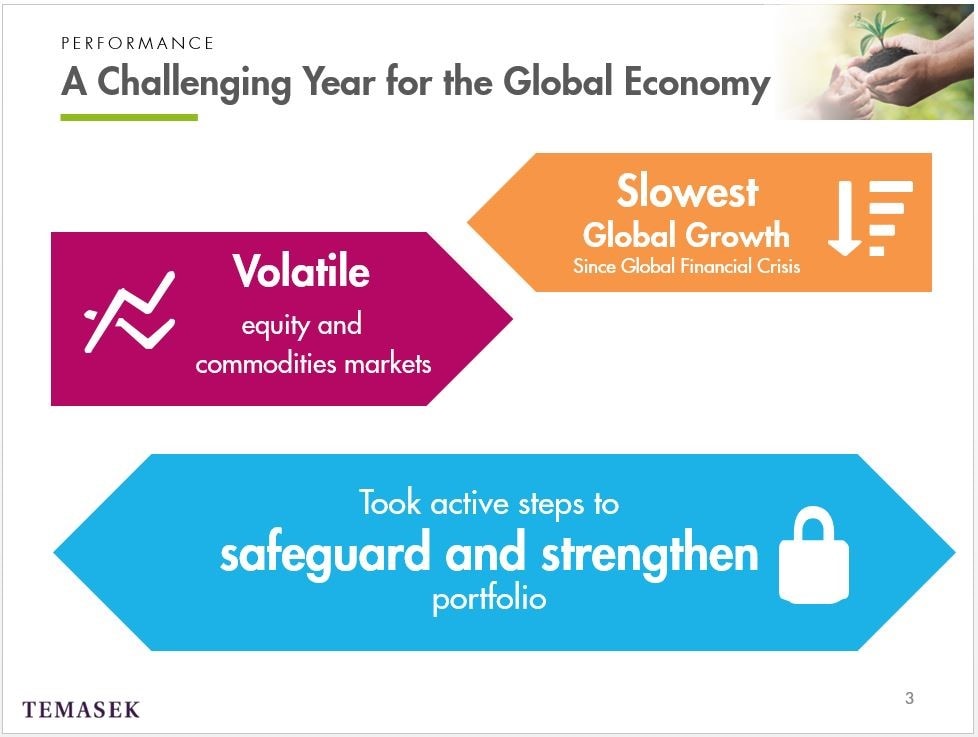
2015 marked a challenging year for the global economy with the slowest rate of expansion since the financial crisis. Equities and commodity markets were volatile, reflecting concerns around growth and supply and demand imbalances in the commodities market. We took active steps to safeguard and strengthen our portfolio positioning it to meet current and future challenges.
We ended the year with a portfolio value of S$242 billion. This was down S$24 billion from last year, largely due to fall in market values of our listed portfolio. Our portfolio value has nearly doubled over the last decade.
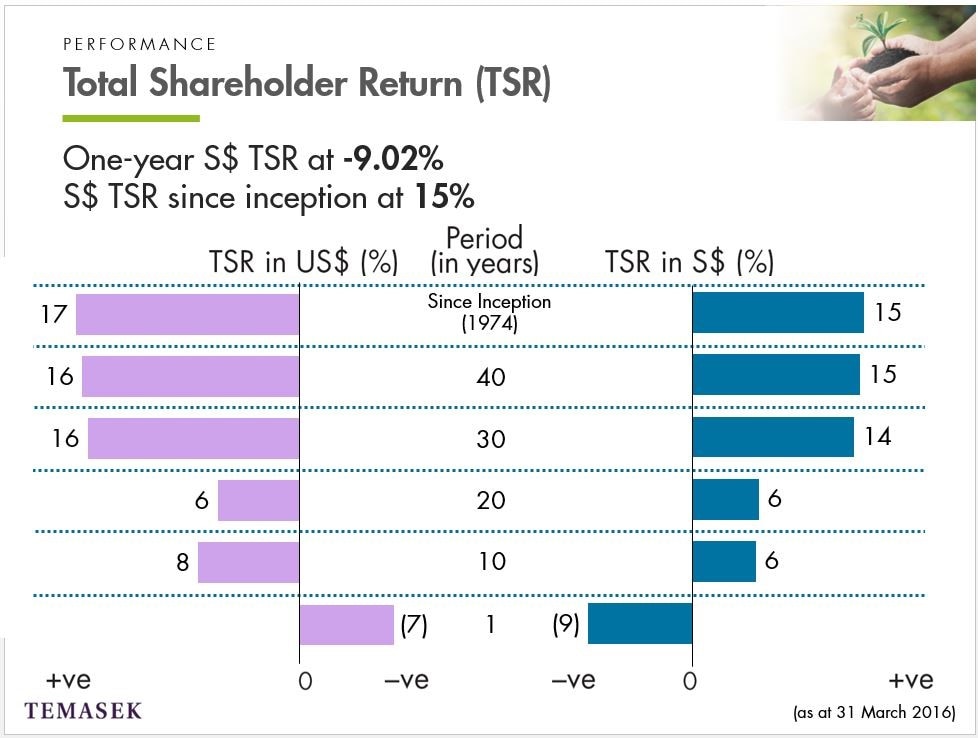
This next chart shows our Total Shareholder Return, or TSR, over different time horizons. TSR measures the return that we deliver to our shareholder. It includes dividends paid to the shareholder but excludes capital injections from our shareholder. Our one-year TSR was negative 9.02% in Singapore dollar terms. A significant factor was the share price declines of our listed investments, which are marked-to-market and are therefore not realised losses. Longer term 10- and 20‑year TSRs were both 6%. Our TSR since inception in 1974 was 15%. You can also see here for your reference our TSR in US dollar terms.
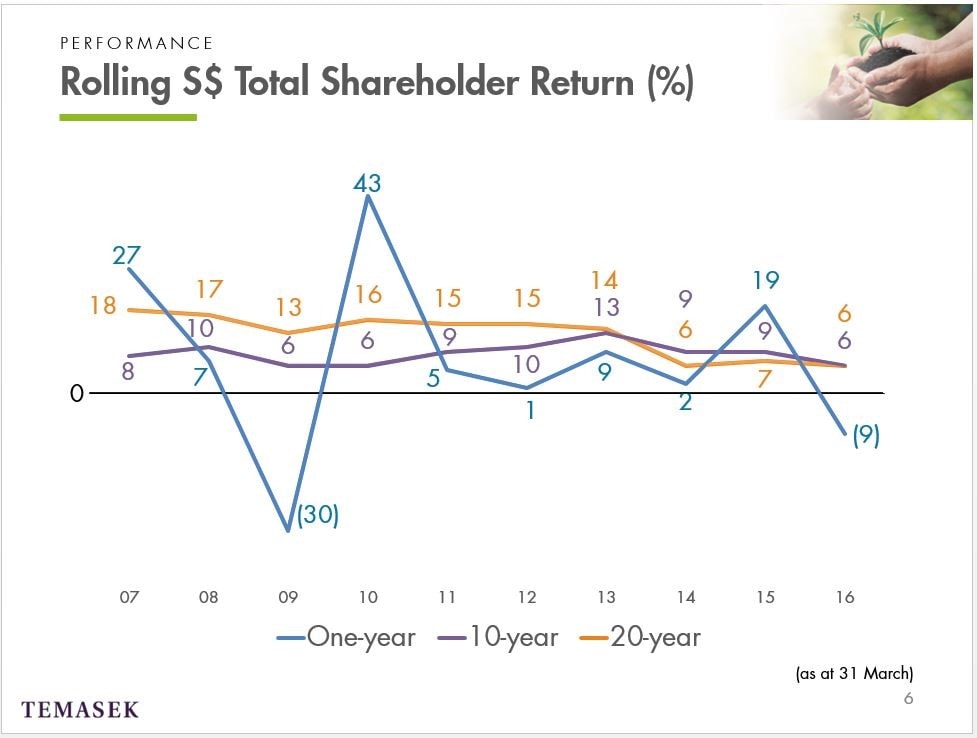
We show here our rolling TSRs over different time periods over the last decade. Our 1‑year TSR, the blue line, as you can see, is quite volatile as it captures year‑on‑year changes in the market value of our portfolio. For example, it fell to a negative 30% in 2009, only to rebound 43% the following year. As a long term investor, we believe that a longer term 10- and 20‑year TSRs, in purple and orange, are a more accurate reflection of our performance and you can see they're relatively stable over the years.
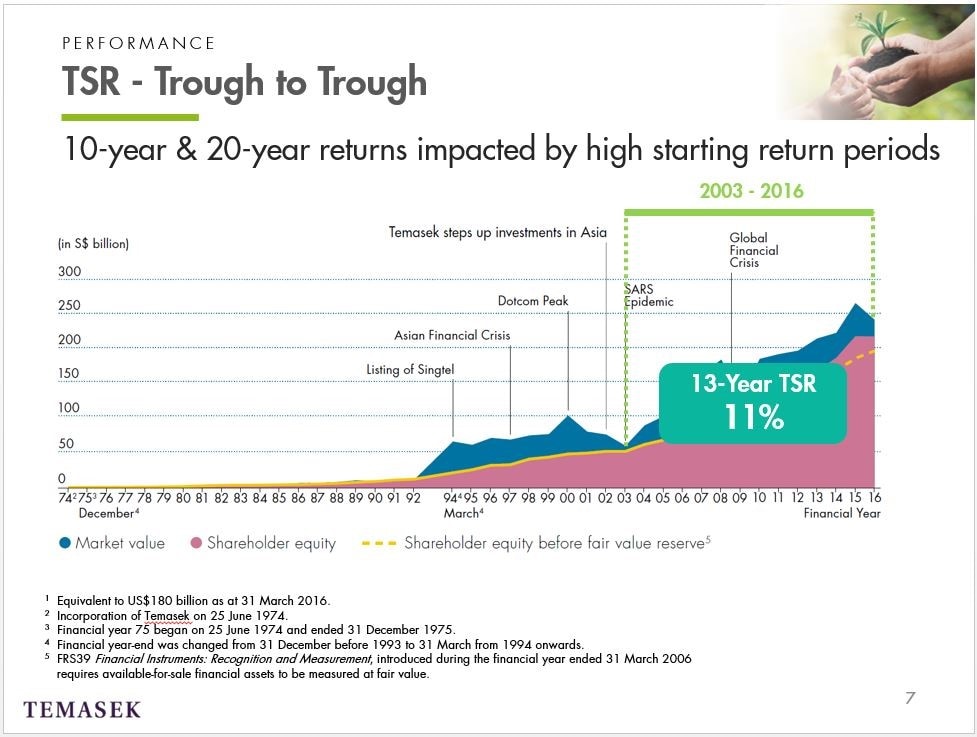
Of course, our returns are measured between two points in time, this can be quite volatile. So it may be useful for you to know that our 10- and 20‑year TSRs were impacted by high starting bases. If you were to look at return, from a trough to trough perspective, say from 2003, after SARS, to 2016, our returns for that period were 11%.
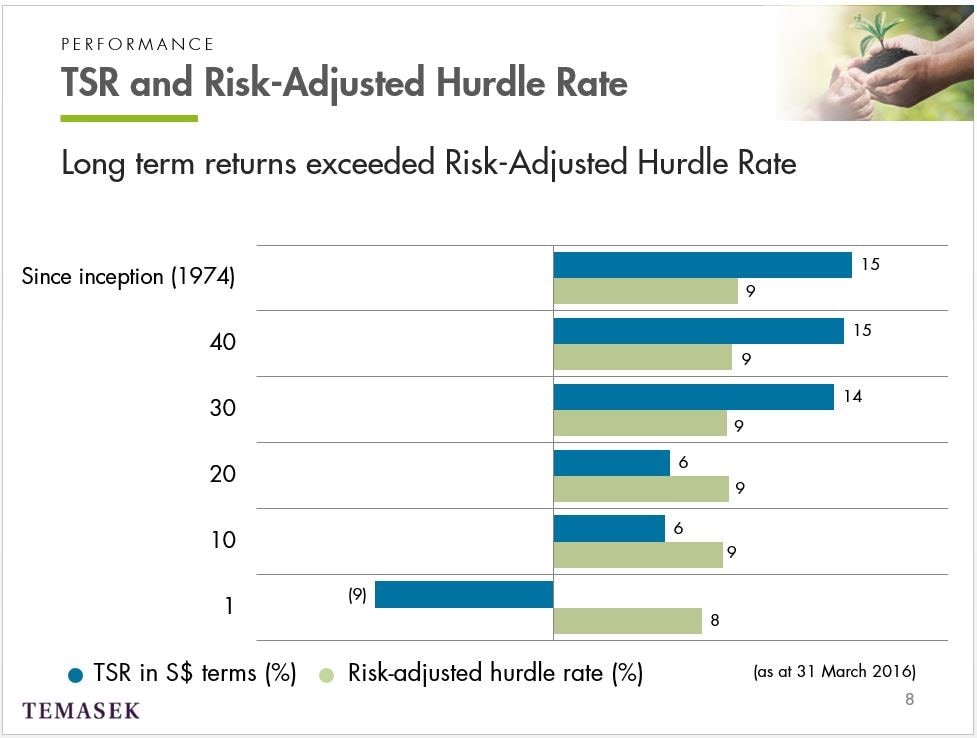
We evaluate our performance by comparing our TSRs against our risk‑adjusted hurdle rate. Our aggregate risk‑adjusted hurdle rate has declined over the years to around 8%. As risk free rates have declined and our portfolio risks have also been lowered. The blue bar shows Temasek's returns and the green bar shows our risk‑adjusted hurdle rate. Our returns of negative 9.02% were below our risk‑adjusted hurdle rate.
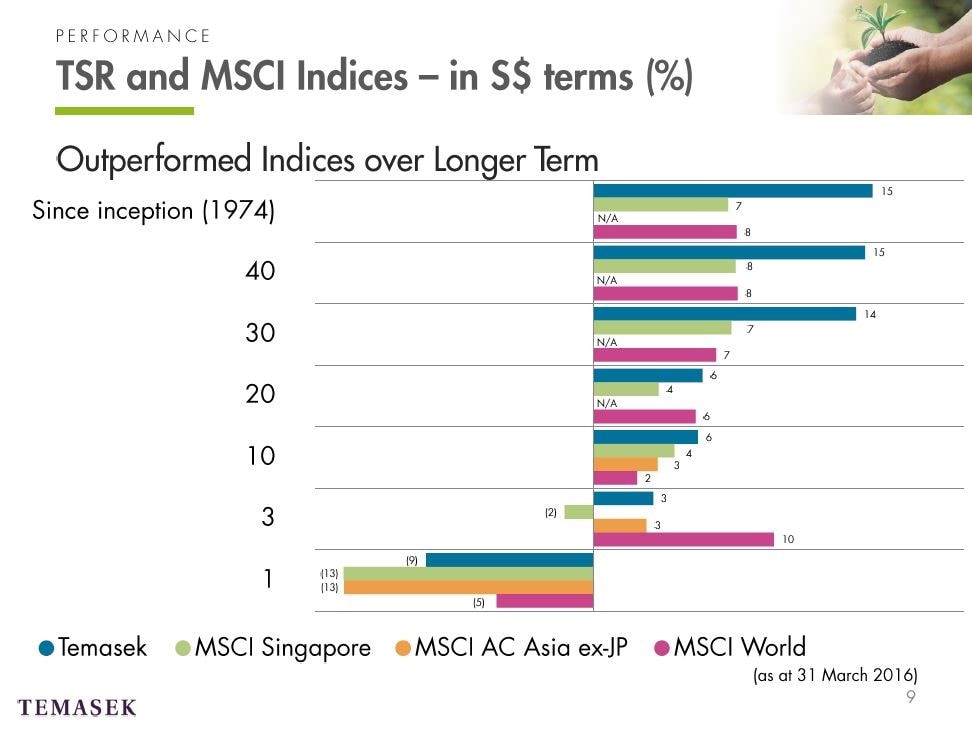
This chart shows our returns placed alongside public market indices ‑ MSCI Singapore, MSCI Asia ex‑Japan and MSCI world. Now we're not a fund manager, we don't manage our portfolio according to benchmarks, in fact our portfolio is very different. We have the ability to take long term concentrated position, we invest in non‑listed assets. But we're often asked for comparison. So this provides one frame of reference. As a long term investor, over longer time horizons, we have generally outperformed these indices, particularly in Asia where we remain anchored.
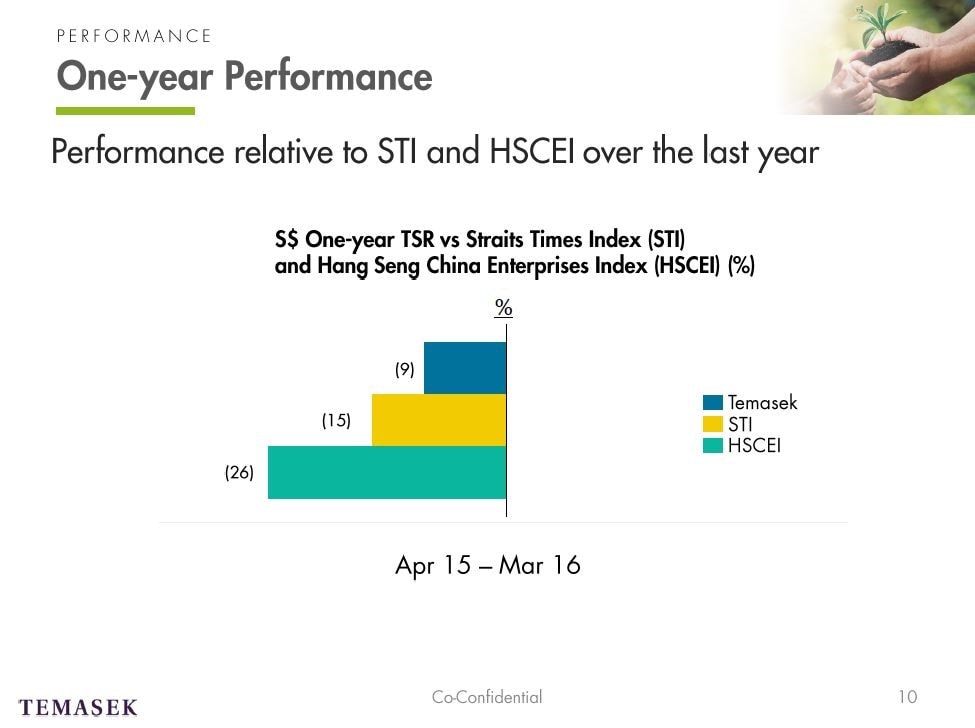
We show our one‑year TSR against the Straits Times Index and the Hang Seng China Enterprise Index. Now this is relevant because 66% of our listed portfolio is listed on the STI and the HSCEI. Both the STI and the HSCEI posted negative returns last year. Our one‑year portfolio TSR were far more resilient than these indices.
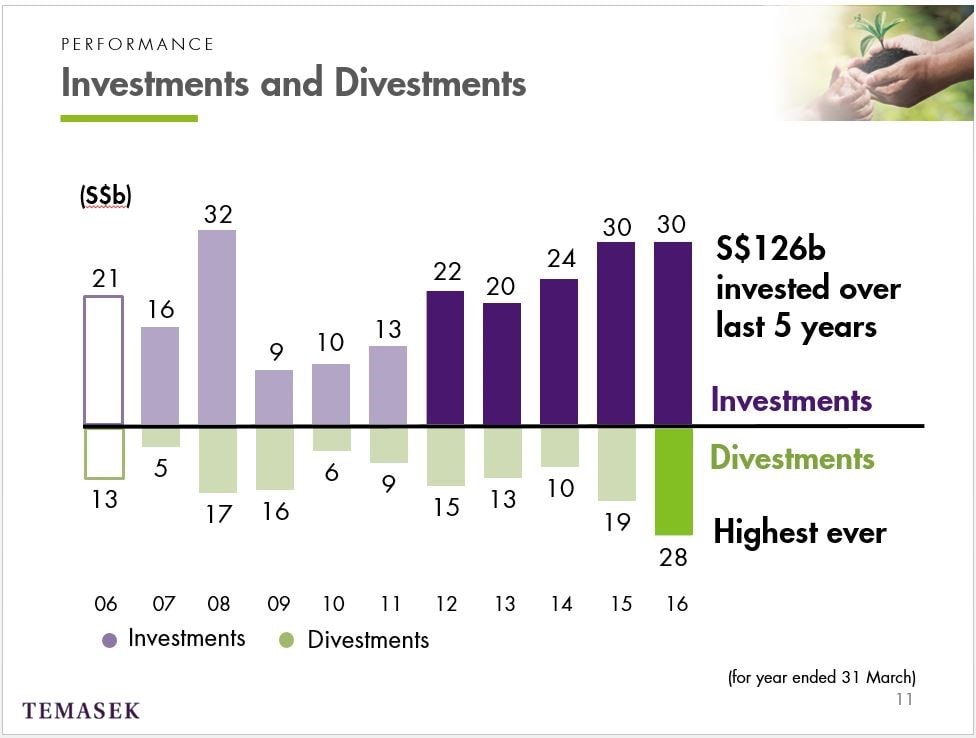
Let me now move on to talk about how we're positioning our portfolio. As an active investor we've invested S$126 billion over the last five years and this is part of positioning our portfolio towards longer term or emerging trends. Our divestment last year were our highest ever at S$28 billion. Quite simply, we took advantage of the liquidity‑fuelled rally in the first half of the year.
Let's now take a look at how the portfolio has evolved ‑ consumer, life sciences, energy and resources have grown from a combined 6% of the portfolio to 14% today. These sectors were ones that we identified as key beneficiaries of growing middle income population growth. We see increasing demand for consumer goods, for healthcare, for agricultural and energy commodities and our investment in this area includes positions in Gilead, ThermoFisher, AS Watson and Dufry.
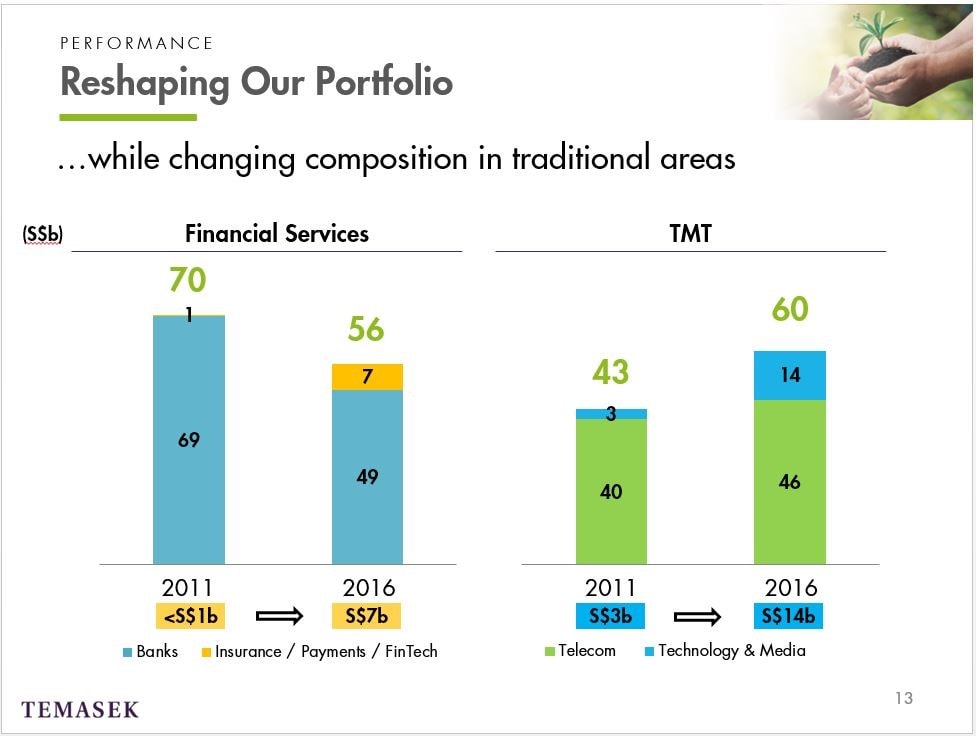
Even within the traditionally larger sectors such as financial services and TMT, we've been shifting the weight of the portfolio towards area where we see greater growth potential. In 2011, within financial services, banks comprised almost all our exposure. Our exposure to financial services has decreased but within that our exposure to non-bank financial services ‑ insurance, payments, financial technology ‑ has actually increased and is now about one-eighth of the overall financial services portfolio.
Some of our new investments in this area includes AIA, Ping An and PayPal. Likewise, telecoms comprise a vast majority of our TMT portfolio in 2011. The TMT portfolio has grown, the telecoms portfolio has grown but tech and media has grown even faster and is now almost a quarter of the portfolio at S$14 billion.
So how has this shift affected our returns performance? We will show you the performance of new investment in these focus areas against the overall performance of our portfolio, which is the line in purple. Returns in tech investments have clearly outperformed, as have returns in non-bank financial services and life sciences. Investment in consumer are in line, investments in energy and resources have underperformed but this is consistent with the performance of the sector globally. Over the long term we still see continued demand growth for energy and resources.
Our exposure to new focus areas has increased from S$15 billion to S$56 billion, from 8% to 23% of the portfolio. In summary, we're actively shifting the weight of our portfolio towards companies that benefit from key macro trends in line with our investment themes. And it is this, that is helping us build and strengthen the resilience of our portfolio.
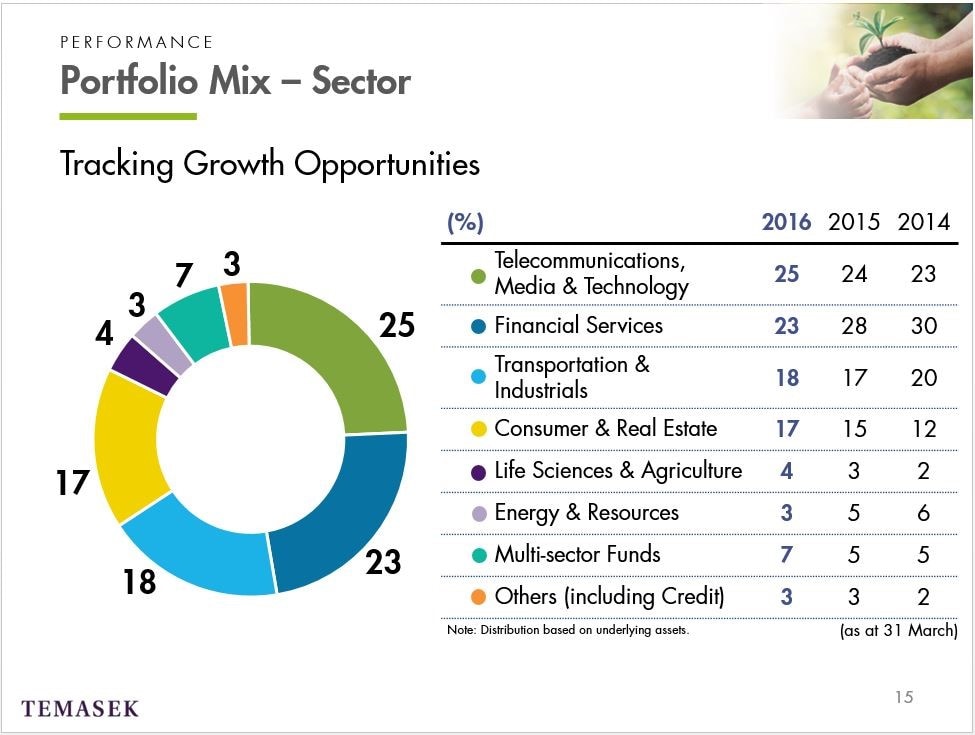
So what does this mean for our sector mix? The TMT sector in green has grown steadily over the years. It is now our largest sector at 25% of the portfolio. During the year in this sector, we made investments in Airbnb, Didi Chuxing and Meituan‑Dianping as examples. Our financial services portfolio, in dark blue, now stands at 23%.
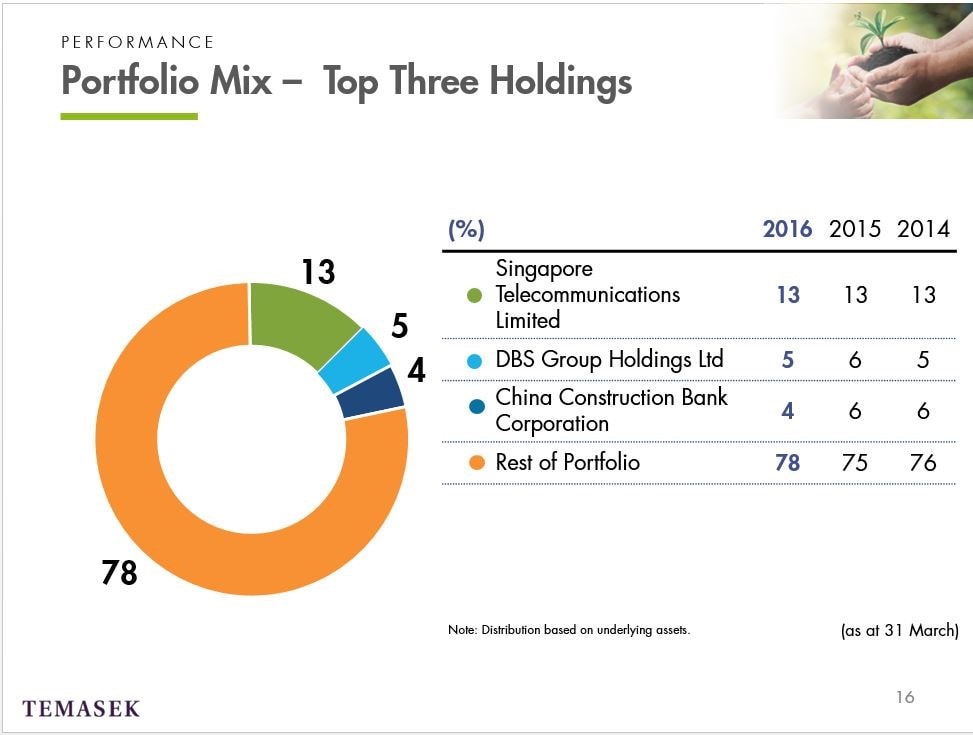
In terms of concentration, SingTel remains our single largest exposure at 13%, this followed by DBS at 5% and China Construction Bank at 4%.
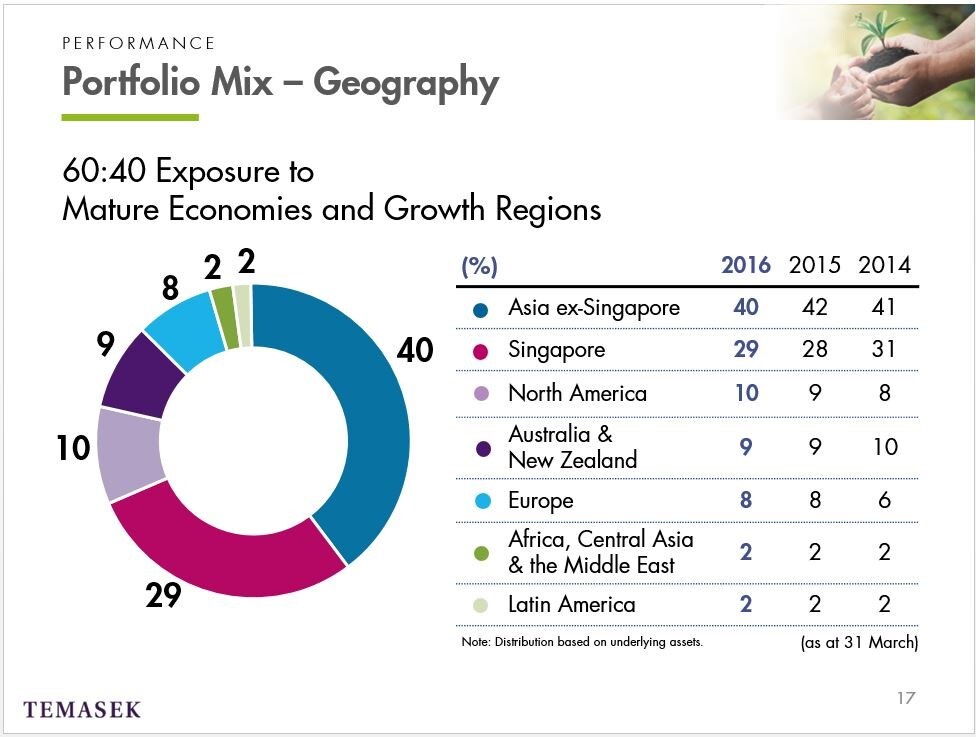
This diagram shows our portfolio mix by geography where the distribution is based on underlying assets. Let me explain how this works. Let's take SingTel as an example. SingTel is listed in Singapore but has assets outside Singapore, in Australia, in India, in Indonesia. What we do when we look at our portfolio mix by geography is we allocate the value of our holdings in SingTel based on its assets in those countries. So based on this cut, in 2016, Asia, including Singapore, represented 69% of our portfolio. Singapore remains our single largest country of exposure at 29%, followed by China and the US.
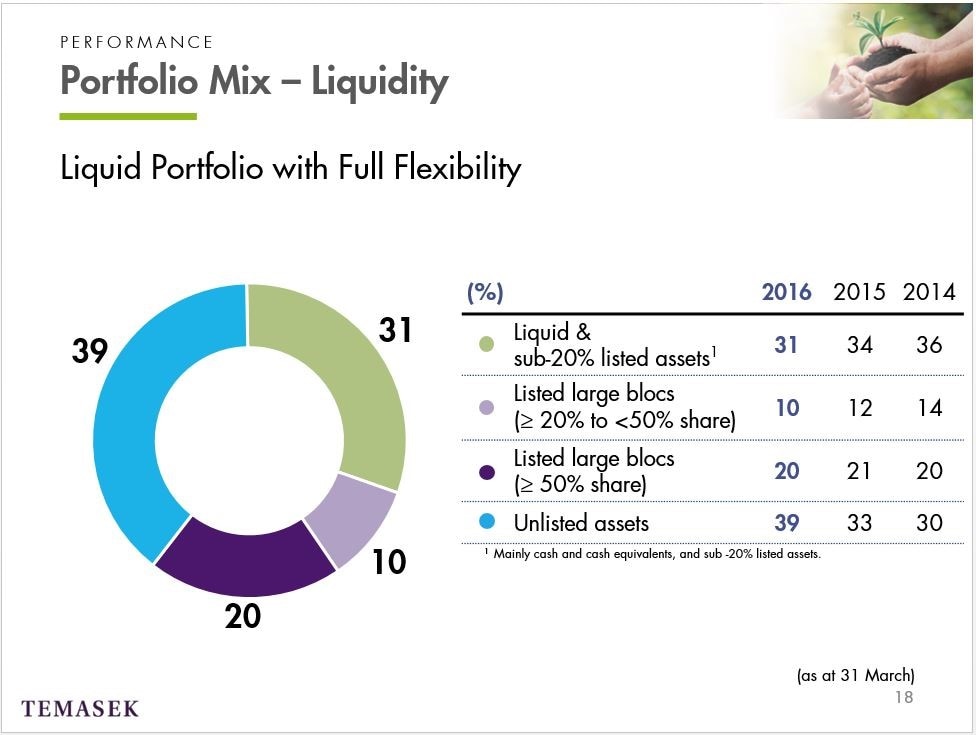
Let us now look at our portfolio from a liquidity perspective. Our portfolio remains very liquid. 61% of our portfolio were held in liquid and listed assets. The value of our unlisted assets, in blue, grew to 39%. This reflects the steady performance of these assets relative to the mark‑to‑market movements of our listed assets.
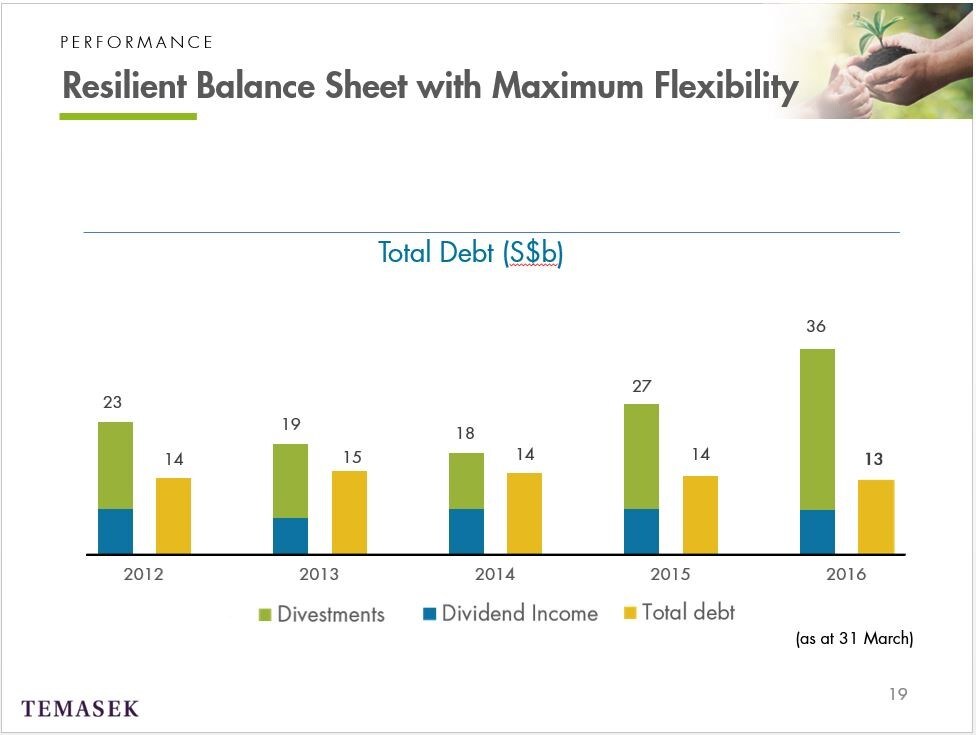
Temasek's issued debt, which comprises our Temasek bonds and our Euro‑Commercial Paper stood at S$12.9 billion. We manage our finances for maximum flexibility, even in times of extreme economic stress. Our key recurring cash flow includes dividends from our portfolio, and divestment proceeds and we ensured that cash flows from investments can meet our nondiscretionary expenses. Our key recurring income was also more than sufficient to meet our total debt.
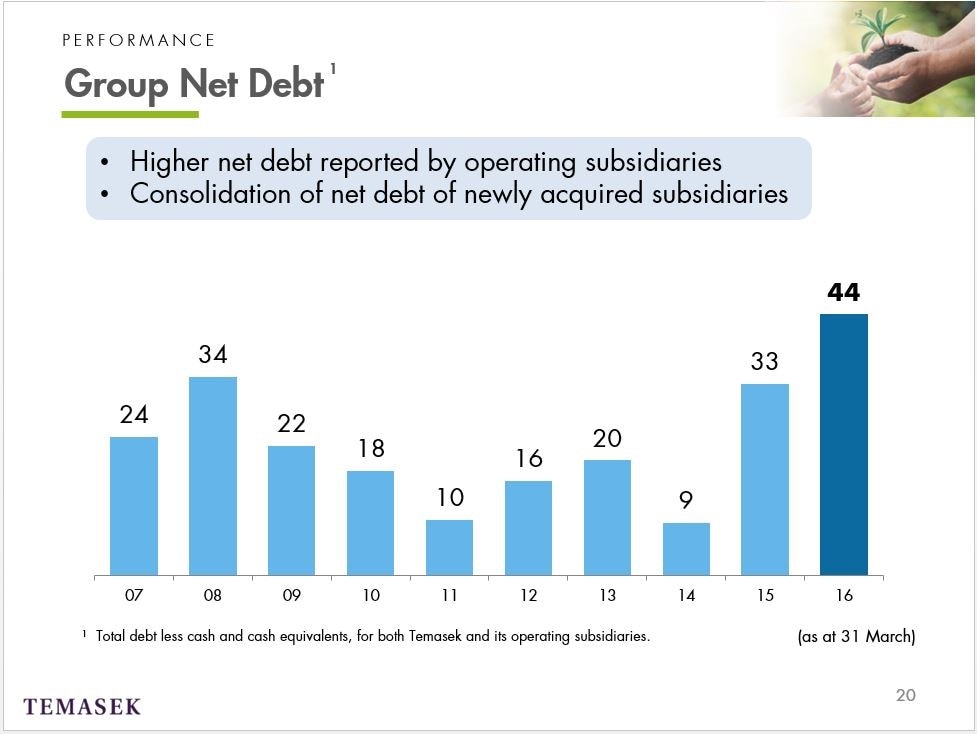
Our consolidated group net debt, which is not to be confused with Temasek's own debt, was S$44 billion as at 31 March 2016. This is actually a consolidation of the debt of Temasek and its operating subsidiaries. The rising group net debt is due to two key factors. First, a number of our operating subsidiaries actually reported higher net debt as they raise financing to fund CapEx as well as acquisitions, for example, Mapletree. And second, the consolidation of net debt of subsidiaries which we acquired during the year, for example Ascendas‑Singbridge.
In summary, while our returns for the year reflected challenging markets, our portfolio continues to be resilient.
We ended the year in the net cash position.
This gives us the financial flexibility to manage our pace of investments, to take advantage of opportunities as they arise, as we evolve our portfolio, as resilience enables us to generate sustainable returns, to make a difference where we can to communities across generations.
And with that, let me hand over to Mike who will take you through our outlook.
MICHAEL BUCHANAN:
Thanks, Chin Yee, and good afternoon, everyone. I'm Mike Buchanan and I will now discuss our views on the economic and market outlook.
In brief, how would we describe the outlook?
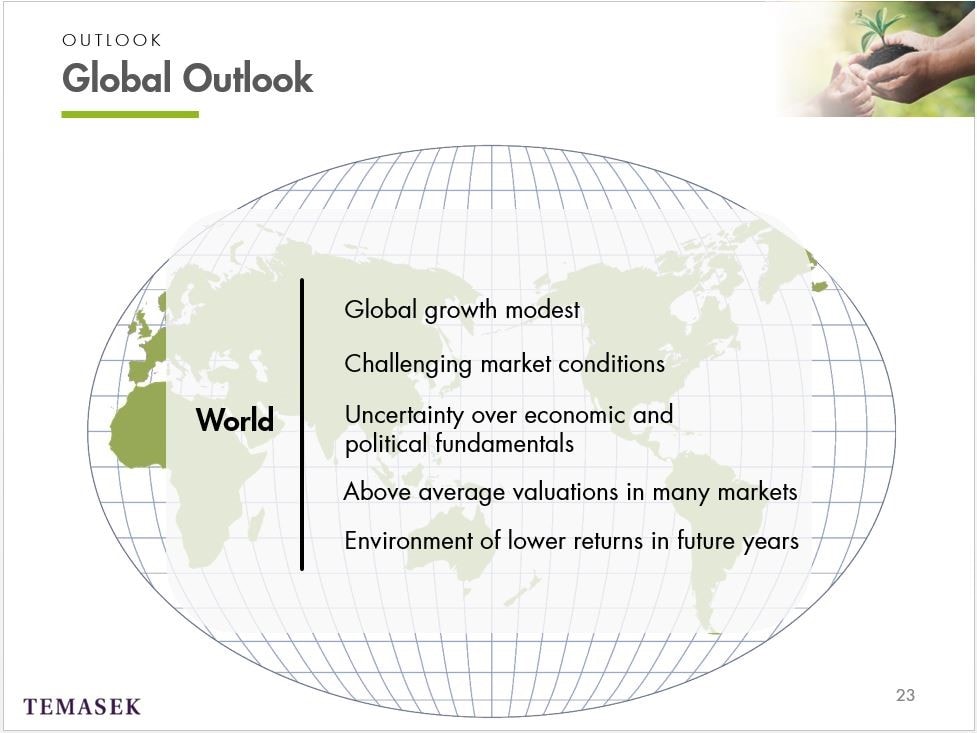
Global growth is unimpressive but it's OK. However, global market conditions are more challenging. Markets, especially in Asia, have been quite volatile and each of the major markets has its own set of issues and I will touch on them as we go through region by region.
Political pressures may increase downside risks, not just the fallout from Brexit, but the rise in Euroscepticism more generally, particularly ahead of key elections next year. Yes, there's uncertainty over economic and political fundamentals but we remain focussed on the long term.
In key markets, we are seeing examples of valuations that are on the high side.
Overall, uncertainty has increased, partly reflecting the ongoing hangover from the excesses that helped create the global financial crisis and so we see an environment of generally lower returns in the years ahead.
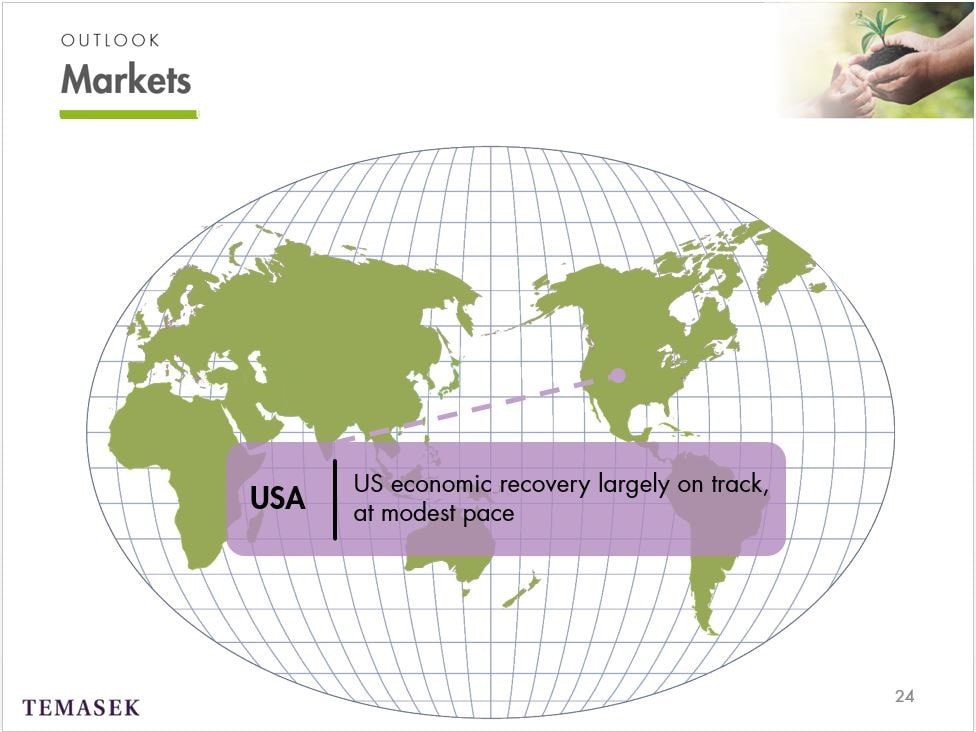
Now let's spend a moment looking at each of the major markets in a bit more detail, starting with the US.
The economic recovery is largely on track and should continue, though at a pretty modest pace. Valuations are above average but for now they're helped by super low interest rates.
We have to be disciplined and selective about the opportunities we pursue and why is that? Well, as business cost pressures increase, with consumption growing OK but at a pace that is still below the pre‑GFC years, profit margins and valuations may come under some downward pressure.
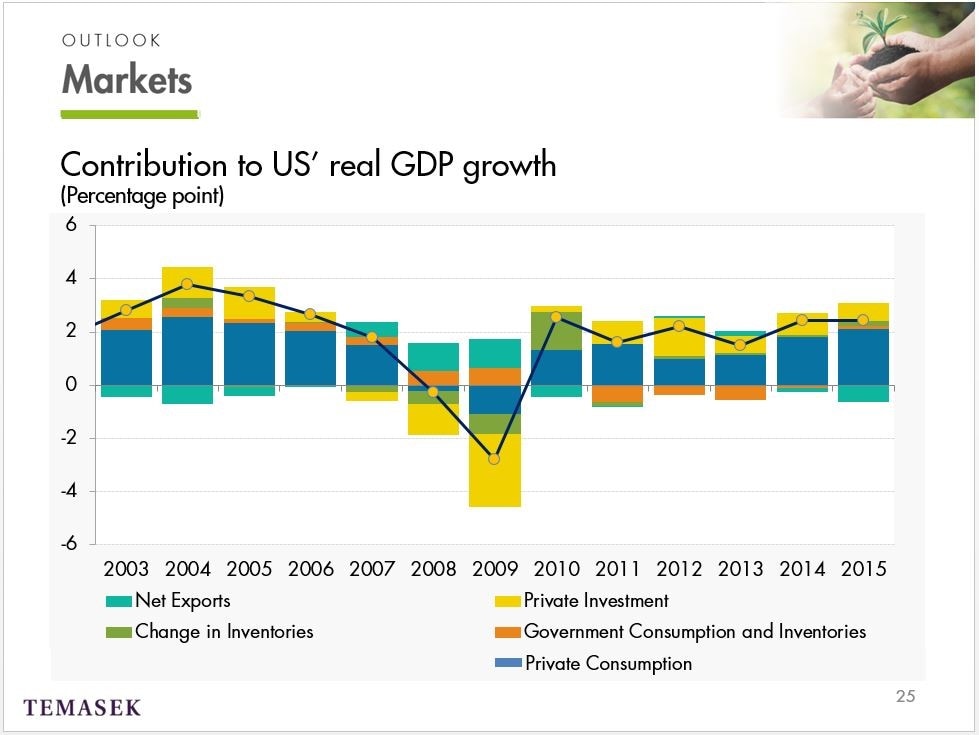
Let's look at how the US economy is performing. The US is likely to remain a mildly positive driver for the global economy and monetary policy will still be reasonably accommodative.
As we can see in the black line on this chart, growth has been a bit above the normal or trend rate over the last two years, though that's partly because trend is a bit lower than it used to be. There are pockets of strength, particularly in the housing and labour markets, and that's important for private consumption shown here in the blue bars and which has been a key driver of growth since the GFC.
In terms of monetary policy, which has implications around the world, not just in the US, the Fed is likely to continue to see the risk of tightening too soon as greater than the risk of tightening too late. And so overall, the Fed is likely to move only very gradually towards a further policy tightening.
I think some of you may be interested in our views on China.
While there is uncertainty, our baseline view is that China will overcome its challenges and transition to a more sustainable growth path in the medium term. An effective rebalancing will rely on the timely implementation of the Government's own reform agenda and that would allow the market to play an increasingly decisive role in the economy.
Some argue that for China to move to a more sustainable path, there will be a need for a moderate slowdown in growth. In part, this is just the result of Chinese rising income levels. As countries get richer, they tend to grow more slowly. It will also mean a greater contribution to growth from household consumption and higher productivity, new economy sectors.
We've been investing in businesses in these areas for some time because we see them as part of China's continuing economic transformation.
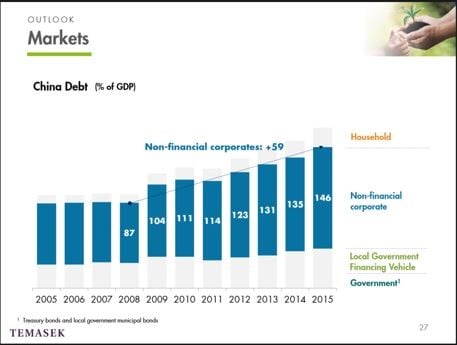
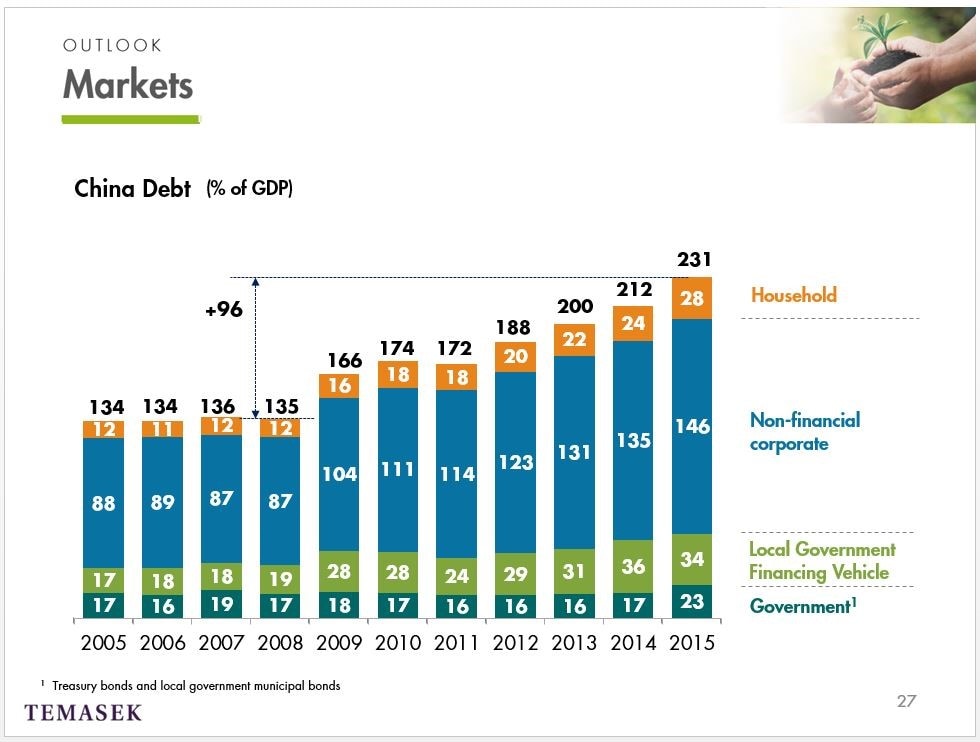
One of the challenges China faces is its high and rising level of debt. As you can see from the numbers above the bars in this chart, total debt has risen by almost 100% of GDP since the policy stimulus during the GFC. This has been especially true for corporate debt which has reached unusually high levels for a country at China's stage of development.
The rapid growth of shadow banking is a related issue which also requires attention. These challenges are significant and the future path may be bumpy but we see that for now, China still has sufficient tools and firepower to tackle these issues.
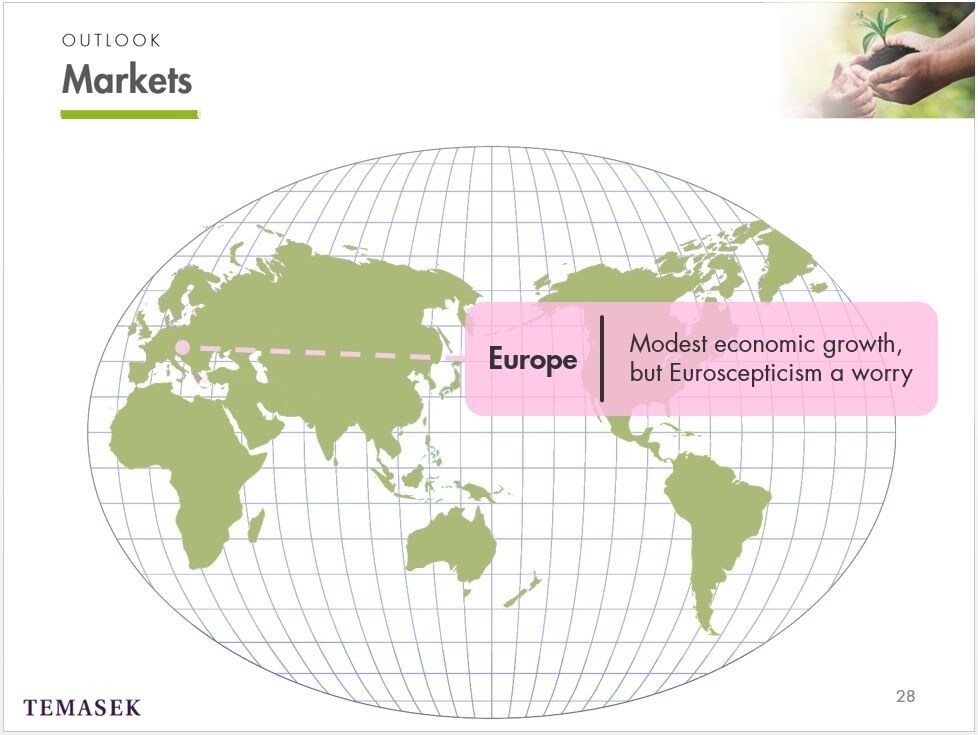
Next up is Europe, which is at an earlier stage of recovery and so is unlikely to face the cost pressures in the same way as the US. That's encouraging.
But there are more fundamental downside risks. European banks remain under pressure from negative interest rates and regulatory uncertainty. Also, non‑performing loans remain an issue in some areas.
Political pressures may increase downside risks. The Brexit vote understandably caused markets to worry but many of the initial concerns have generally calmed down outside the areas that would be very directly impacted. A broader concern ahead of elections in key countries next year is the level of Euroscepticism more generally, and Brexit is just one example of how that can play out.
For those of you interested in how we see Brexit impacting our portfolio, let me just make a couple of brief points. Our exposure to Europe is small, at around 8% of the total portfolio by underlying assets, and much smaller on the basis of listed exposures on European exchanges. Our exposure to the UK itself is even smaller. It's predominantly through Standard Chartered which, while listed in London, does not have substantial banking exposure in the UK.
We remain focussed on the long term so the short term volatility from the last couple of weeks is not our focus.
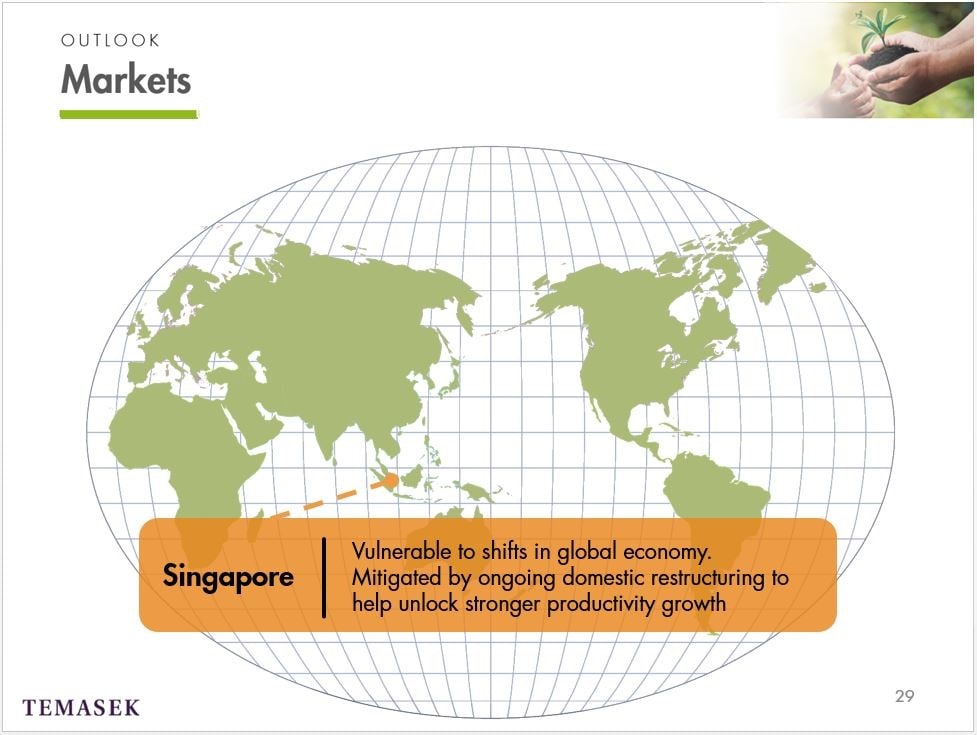
Finally, at home in Singapore. While the economy here is vulnerable to the shifts in the global economy, the efforts on domestic restructuring should help to unlock stronger productivity growth in the medium term. Singapore's openness means continued exposure to both mature economies and new regions and businesses which will provide opportunities for growth in the future.
In addition, sound macroeconomic fundamentals, coupled with intensive investments in technology, innovation and human capital help to anchor growth for Singapore and Singapore‑based companies.
I want to shift gear a little bit now and spend a few minutes on how we see some more specific opportunities. In the video, we highlighted that we remain committed to our four key investment themes.
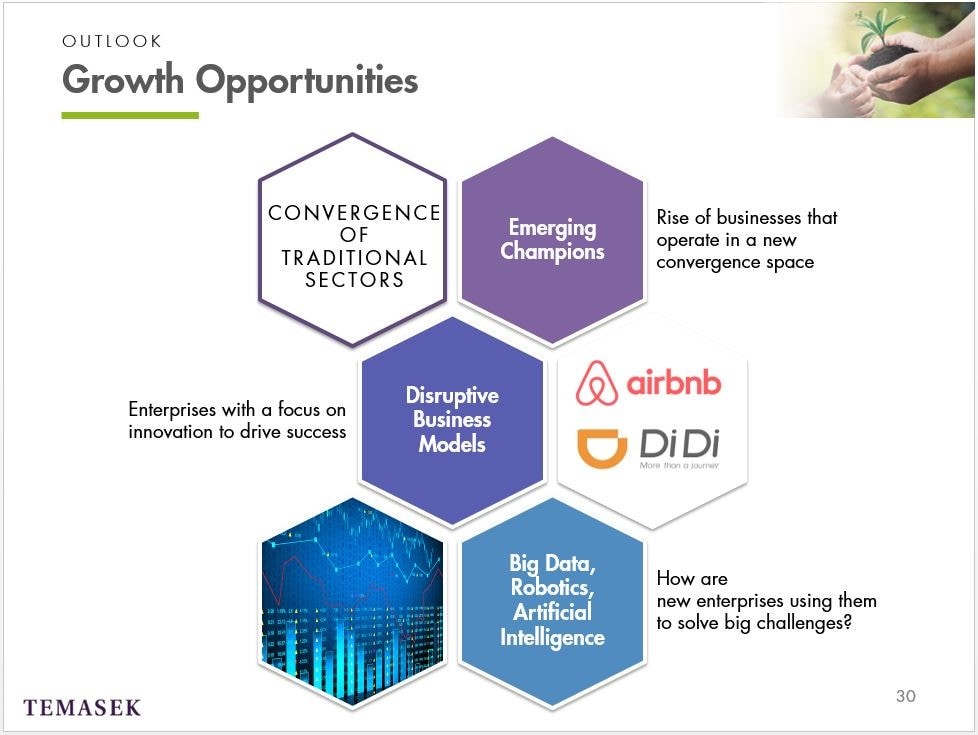
Chin Yee has already shared with you the reshaping of our portfolio over the past five years. So in line with that, there are a couple of areas in which we see companies evolving across traditional sectors to create whole new business segments.
We look at these because from them we can identify new emerging champions and so perhaps the next Alibaba.
Today's mobile enabled sharing economy and changing consumption patterns among the middle income groups give rise to new businesses, some of which weren't even conceivable just a few years ago. We were investing in this space well before the buzz words "sharing economy" became so popular. Airbnb and Didi Chuxing are some current examples of companies that we've invested in that are taking advantage of the sharing economy and we're also looking at big data analytics, robotics and artificial intelligence.
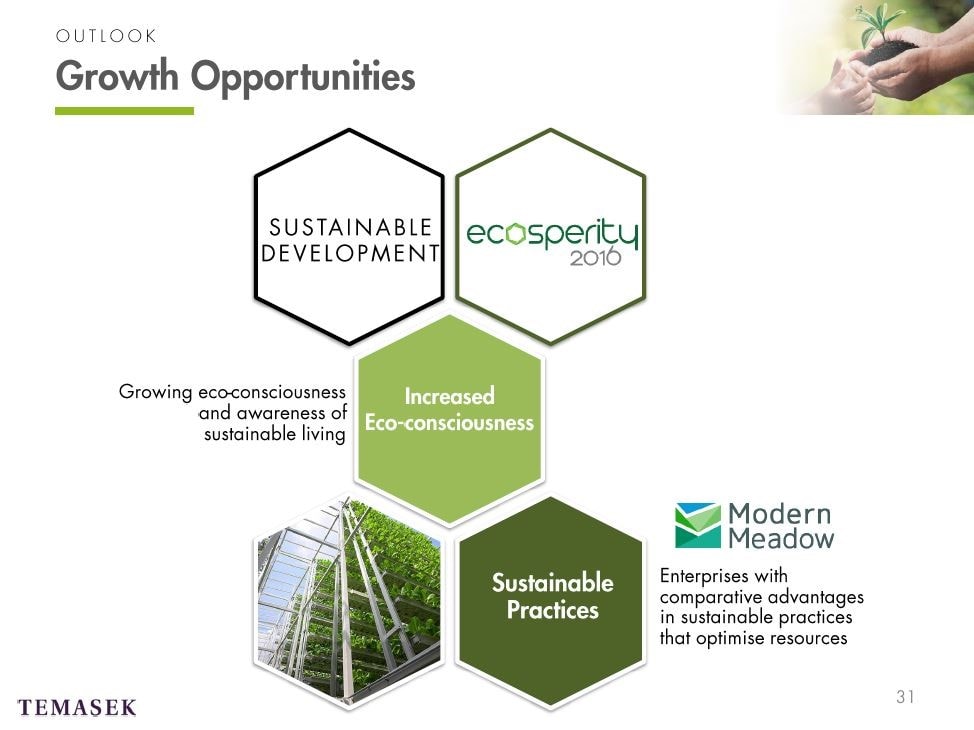
Another growth opportunity we see fitting neatly within our investment themes is the move to more sustainable development. We've been bringing together our portfolio companies and others to share insights on these issues for the last few years at our annual Ecosperity conference.
So firstly there is a growing eco consciousness and awareness of sustainable living among middle income consumers. There is an increased demand for products to be manufactured in an eco-friendly and sustainable manner to reduce waste. For example, technologies to manufacture environmental friendly packaging that can reduce spoilage and improve shelf life.
In addition, as consumers are increasingly aware of the impact diet has on their health and finite global resources, substitutes such as plant‑based protein alternatives are interesting developments. We also see opportunities in companies with a comparative advantage in optimising resource efficiency, concepts like vertical farming which improve land efficiency and reduce water use. The smart distribution of energy and bio fabrication using living cells and collagen protein to grow leather. These are all areas of interest.
For example, just last week, Temasek made a Series B investment in a bio fabrication company called Modern Meadow.
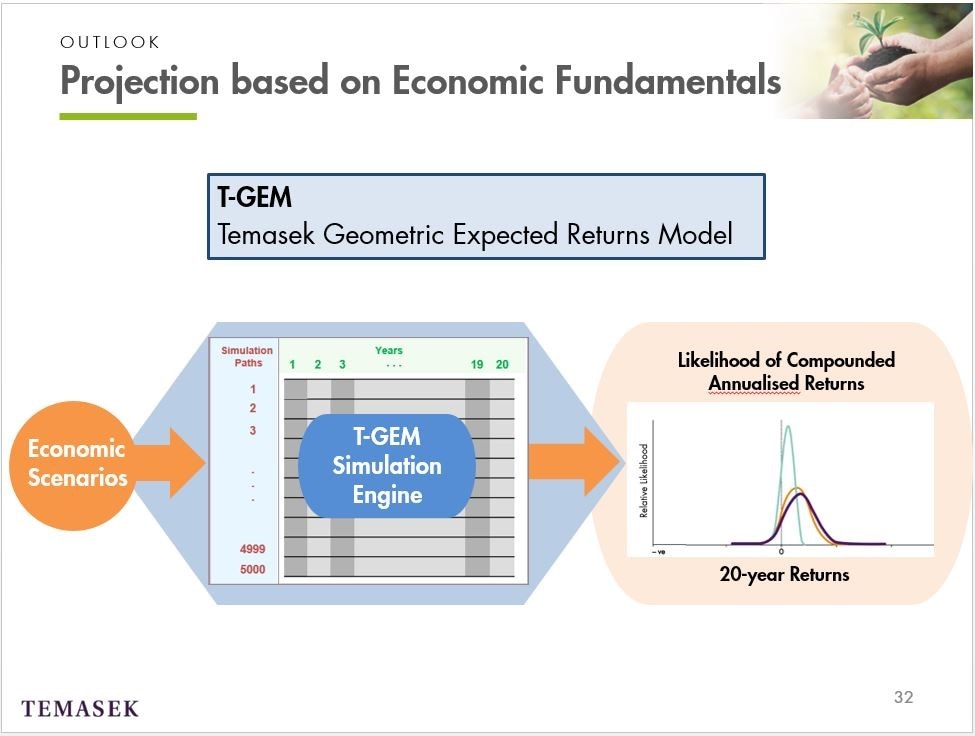
So as we look ahead, how do we project our returns over the long term? Given our quite unique portfolio, we have our own model for long term expected returns, which we call T‑GEM, Temasek Geometric Expected Returns Model. I know the name is a bit of a mouthful, sorry about that, but the model itself is important to digest. T‑GEM uses a scenario-based approach to incorporate our views of fundamentals over the next 20 years.
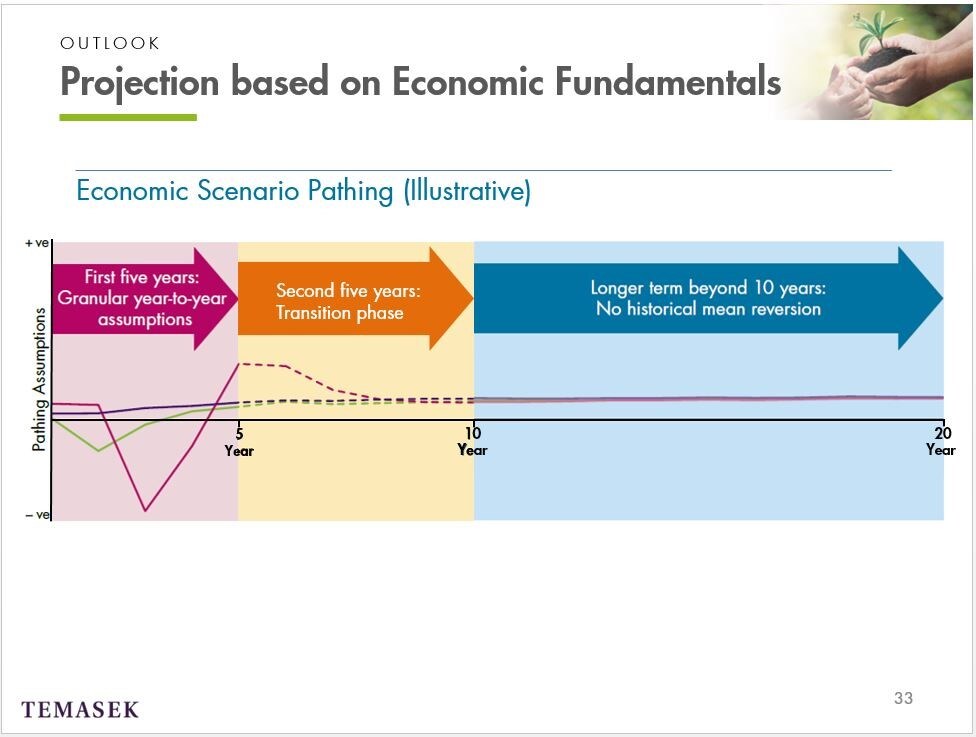
In projecting economic fundamentals, we have very specific and quite granular year‑to‑year assumptions for the first five years. We have more high‑level, long term assumptions beyond year 11. And for the intermediate period of year six to 10 we build in a transition phase to move from year five to those long term forecasts.
As the world is quite uncertain, we have three potential scenarios with key differences in the fundamental assumptions in each of the scenarios.
We focus on our Central Scenario which refers to our baseline expectations of growth and the other key variables, in other words, that's the most likely scenario. So we first use those scenarios to build forecasts for all the key equity markets around the world and then we apply the Temasek portfolio mix to those forecasts to simulate the 20‑year returns on our portfolio.
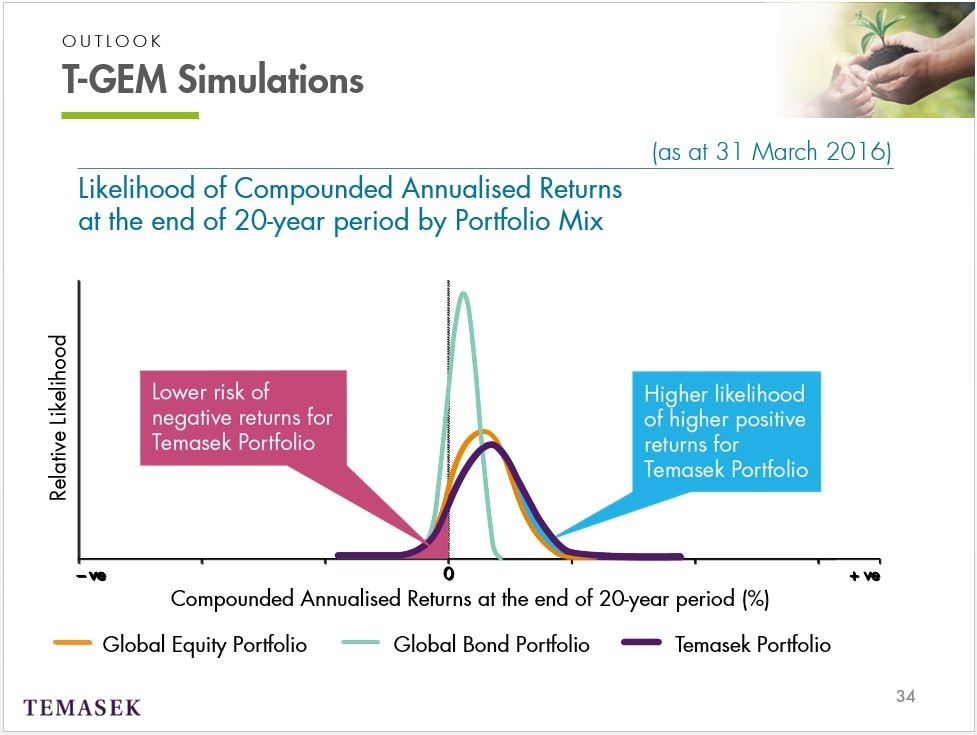
What kind of returns does T‑GEM forecast for us then? In this chart, for our Central scenario we show the simulated 20‑year returns for a generic Global Equity portfolio in orange, a Global Bond portfolio in teal, and the Temasek portfolio in purple.
You can see that the purple line is generally a bit further to the right than the other lines. This means that T‑GEM predicts that under our Central scenario the Temasek portfolio has the highest upside potential. The gains over just the generic Global Equity portfolio are shaded in blue and highlighted by the blue box.
It also shows that over the same timeframe the risk of negative returns, which is shaded in red, is lower for our portfolio than for a generic Global Equity portfolio.
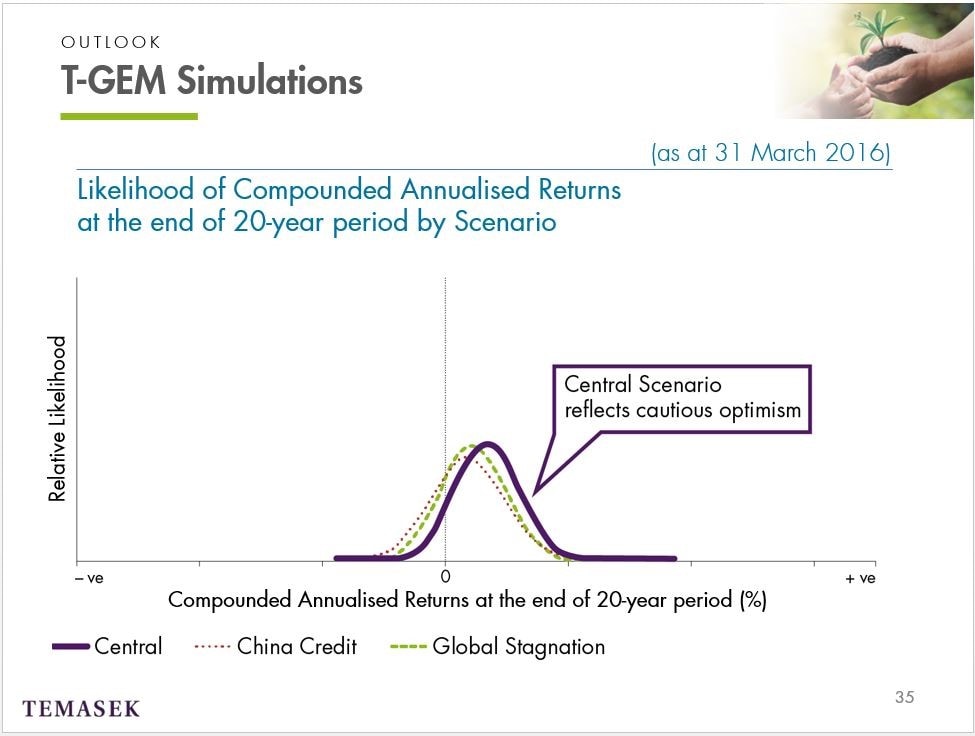
Of course, the world is an uncertain place so as I highlighted earlier, we also use T‑GEM for alternative scenarios. I talked to you in the last slide about our Central scenario, which is shown here in purple and is the most likely outcome.
We also model for the much less likely China Credit and Global Stagnation scenarios. As the red and green dotted lines show, our expected returns at the end of 20 years would be lower in a China Credit or Global Stagnation scenario compared to the Central scenario.
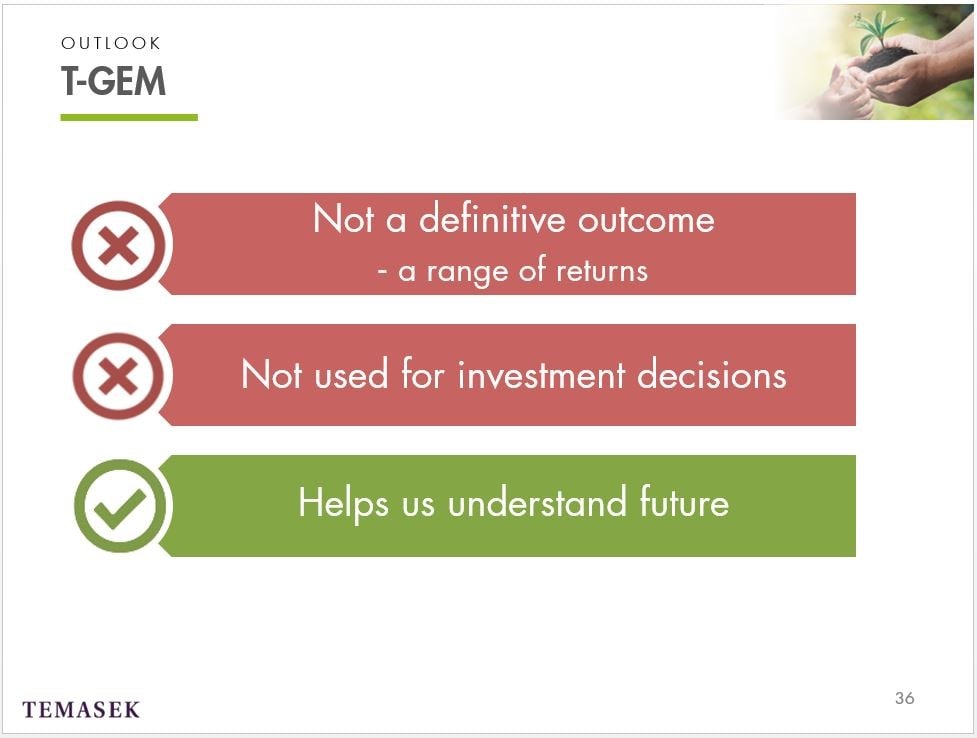
It's important to stress that T‑GEM does not give us a definitive outcome of what our returns will look like. It's likely our returns would vary within the range being higher or lower than the peak point on the distribution curve which is just the most likely outcome amongst many.
I should emphasise that we don't use T‑GEM to directly decide which investments to make. Fundamentally, we are an intrinsic value investor, investing in opportunities because they meet our value test on a case‑by‑case basis.
But it does help to understand how we see the future and how we focus on long term outcomes rather than reacting to year‑to‑year cycles of volatility that are inevitable for an equity investor like us.
So, I hope the combination of Chin Yee's presentation on our results and my presentation on how we see the opportunities for Temasek has given you an understanding of what we've done over the last year and how we see the future.
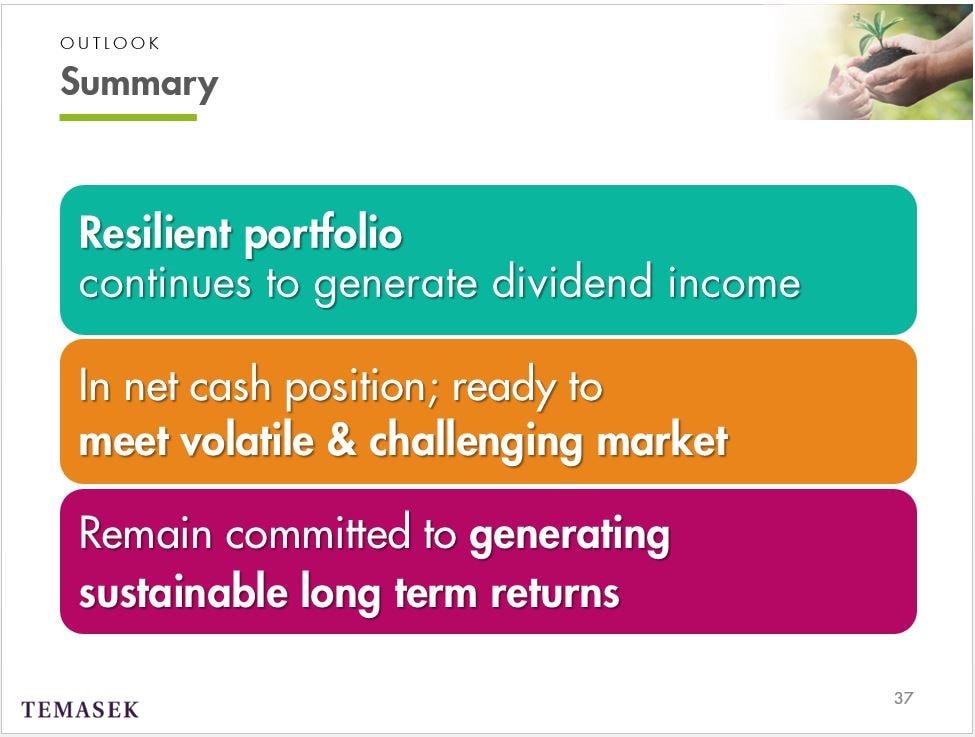
Just to summarise, our portfolio is resilient and continues to generate dividends. We continue to reshape the portfolio to position us for future growth opportunities.
We ended the year in a net cash position ready to meet a more volatile and challenging market in an era of lower returns.
We hold to our commitment to generate sustainable, long term returns.
Our theme for this year's Temasek Review is that we are a generational investor. We may be 42 years old this year, but those who came before us embrace possibilities beyond their time. We are very conscious that every day, even in challenging times like we're in now, we are investing for the generations that come after us. With that, let me turn it back to Stephen to close.
STEPHEN FORSHAW:
Thank you very much, Mike. Ladies and gentlemen, as we invite the rest of the panel to join us on stage for the Q&A, I’ll just remind you that from 3pm you will also find more of this information on our social media channels, on Twitter, Facebook, LinkedIn, Instagram and YouTube if you want to follow us, and if you're not already.