
Portfolio Performance
As owners of our portfolio, we aim to deliver sustainable returns over the long term.
Value Since Inception
We grew with Singapore in our early years. In 2002, we stepped out to build a second wing of growth with a transforming Asia. We have since increased our exposure outside Asia to capture global opportunities in line with the four structural trends.
Our developed and growth market exposure of our portfolio are 66% and 34%, respectively.
Our initial portfolio in 1974 reflected Singapore’s early stages of industrialisation. Some of these companies, and others added since, have grown into iconic Singapore brands, such as the Singapore Zoo. Others, like DBS and Singapore Airlines, have transformed into regional and global champions. As at 31 March 2025, 52% of our portfolio consisted of companies headquartered in Singapore.
We focus on trends driven by technological advances that cater to demographic shifts and sustainability objectives, transforming business models, or shifting consumption patterns.
We continue to seek companies that create new opportunities through innovative and sometimes disruptive solutions.
As at 31 March 2025, our net portfolio value was S$434 billion. Marking our unlisted portfolio to market would provide S$35 billion of value uplift and brings our net portfolio value to S$469 billion.
The chart below shows the growth of our net portfolio value since its inception in 1974.
The blue area reflects our portfolio valued on a mark to market basis, which is subject to greater volatility caused by external events.
The pink area reflects our shareholder equity. From the financial year ended 31 March 2006, the accounting standards require sub-20% investments to be marked to market.
The yellow dashed line reflects our shareholder equity excluding mark to market movement of our sub-20% investments.

1 Incorporation of Temasek on 25 June 1974.
2 Financial year 75 began on 25 June 1974 and ended 31 December 1975.
3 Financial year-end was changed from 31 December before 1993 to 31 March from 1994 onwards.
4 From the financial year ended 31 March 2006, the accounting standards require sub-20% investments to be marked to market.

What is Net Portfolio Value?
How do we value our portfolio?
Temasek’s portfolio is made up of listed and unlisted investments, other assets and liabilities. We derive our portfolio value1 based on share prices2 as at our financial year end every 31 March for listed investments and book values3 for unlisted investments.
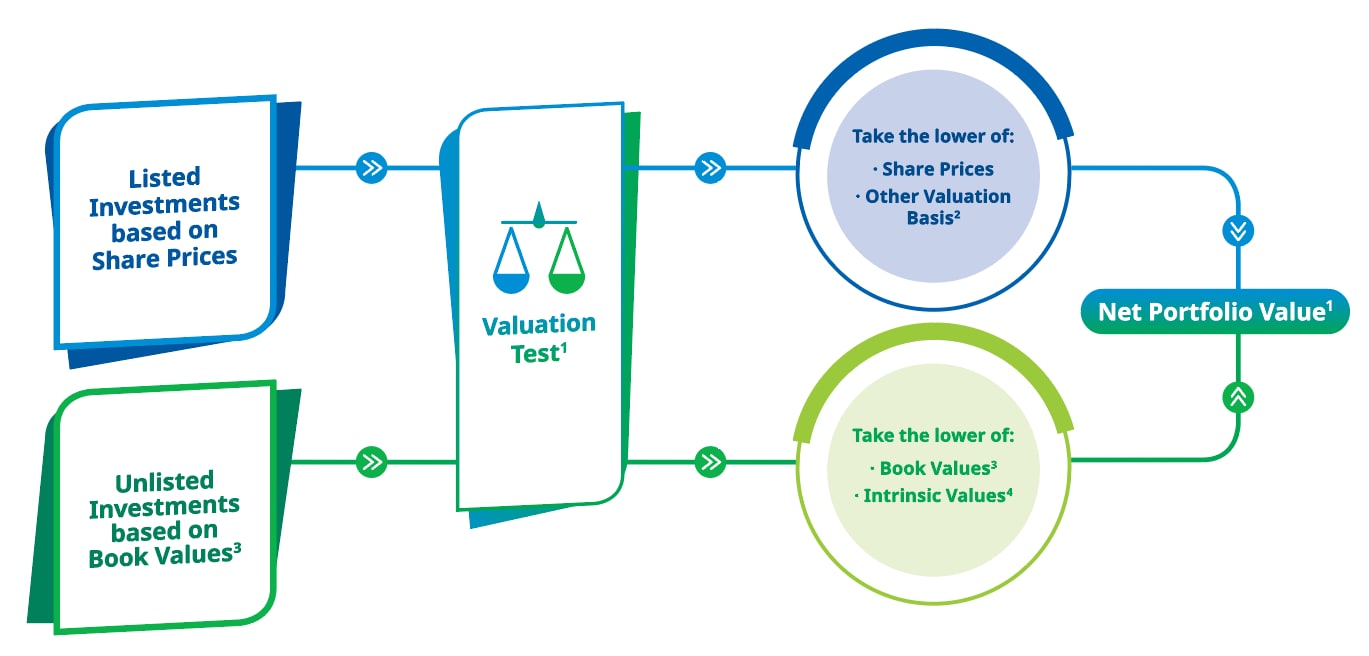
1 Net Portfolio Value is included in the audited statutory accounts. The valuation test is part of the annual financial closing process.
2 For listed investments, other valuation basis will be used if share prices are not representative, e.g. insufficient trading frequency or volume.
3 Book value refers to Temasek’s cost of investment plus our share of the investee company’s profits or losses, changes in other equity reserves, minus write downs (if any).
4 Value based on discounted cash flow projections of the investee company.
S$434b
Net Portfolio Value
Up S$168 billion over the last decade
Net Portfolio Value (S$b)

(as at 31 March)
S$52b
Invested during the year
Invested S$350 billion over the last decade
Investments & Divestments (S$b)

(for year ended 31 March)
What is Total Shareholder Return?
Total Shareholder Return (TSR) is a compounded and annualised measure, which includes dividends paid to our shareholder and excludes investments made by our shareholder in Temasek’s shares. Our TSR over different time periods are a snapshot of our performance, with the longer time periods being more representative of our performance as a long-term investor.
As at 31 March 2025, our Singapore dollar 10-year and 20-year TSRs were 5% and 7% respectively.
5%
10-year return to shareholder
Total shareholder return of 14% since inception
S$ Total Shareholder Return (%)

1 Total Shareholder Return in US$ terms was 5%, 8%, and 15% for 10, 20-year, and since inception periods respectively, based on historical foreign exchange rates.
(as at 31 March)
7%
20-year return to shareholder
Rolling S$ Total Shareholder Return (%)

(as at 31 March)
S$10b
Dividend income
Average annual dividend income of S$9 billion over the last decade
Dividend Income (S$b)
